Exploratory Visual Analysis
Speculation: The Impact of Investors on Boston Housing
Nathanael Jenkins, | naj20@mit.edu
Preliminary Questions
- How far-reaching are the effects of speculation? Is it concentrated in Downtown Boston?
- My father manages property development for a non-profit housing association in London (UK), and has several years of experience developing luxury housing in central London. He explained that international investors used to prioritize the most central locations and refused to purchase property more than 5 miles from Central London. But now, international investors are purchasing property more than 10 miles from the city. In his words, "the investors have moved out." (Jenkins, 2025)
- I am intrigued to see if this same phenomenon is taking place in Boston; it has been driven by significant improvements in public transport in London, so I expect that Boston property investment remains more concentrated in the city center.
- How do corporate owners change their neighborhoods?
- The Homes for Profit (MAPC, 2022) report explores the social and demographic impacts of speculation and inspired this question.
- I'd like to explore this in more detail, and I'm especially interested to see who moves out when corporations move in.
- I would also be interested to see if corporate ownership affects crime rates, although believe this may be outside of the scope of these datasets.
- Are luxury investment properties the primary cause of housing shortages and high prices in Boston?
- It is easy to assume that growth in luxury property is suffocating the Boston housing supply, as implied in Boston's Tower of Wealth (Boston Globe, 2023).
- I'd like to know if it is the root cause or just a contributing factor.
- I'd like to explore how many of Boston's new properties are built for investors (and not locals), and how that trend has changed over time.
- Is there a discrepancy between investment value and owner-occupied property value?
- This question was also inspired by discussions with my father, who explained that investors are often willing to pay above-market rates because they value properties based on ROI rather than the value of living in the property (Jenkins, 2025).
- I am interested to explore whether this trend holds true in Boston; if it does, it would suggest that investors may be responsible for rapidly rising house prices as the market adjusts towards treating properties as a commodity, rather than a place to live.
Stage 1: Dataset Overview
Dataset 1: Corporate Ownership and Owner Occupancy Rates in Boston Neighborhoods with Census, 2004-2024 (MAPC, 2025)
Metadata
The metadata for this dataset provides important context:
- Corporate ownership is determined only based on key phrases in the owner name, meaning that some corporations with obscure names might not be counted correctly.
- The ownership and occupancy rates are rounded to the nearest 1%.
- Data is grouped by neighborhood. Information on which zip code corresponds to each neighborhood is given in a separate data file.
- Census data corresponds to the 2020 census only.
Dataset Relationships and Neighborhood Zip Codes
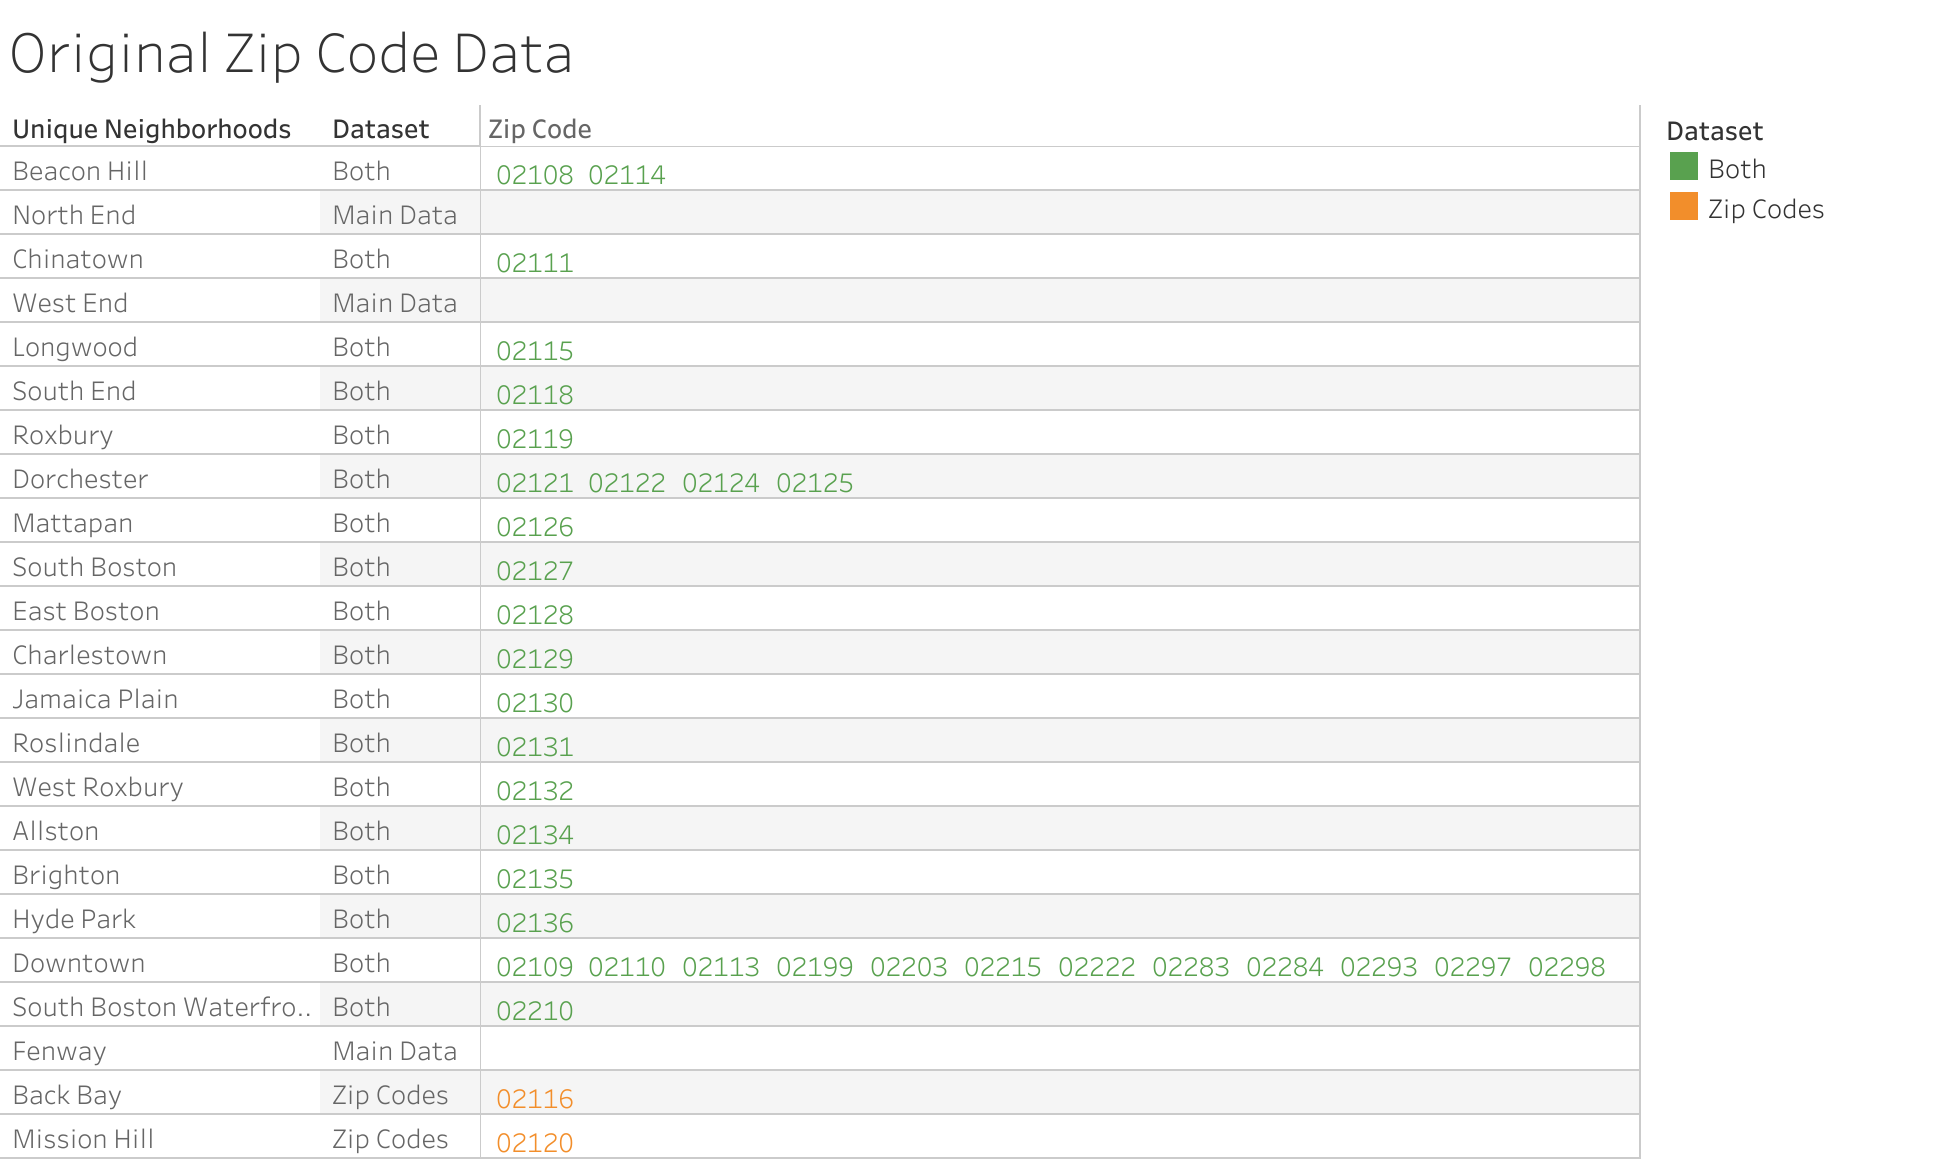
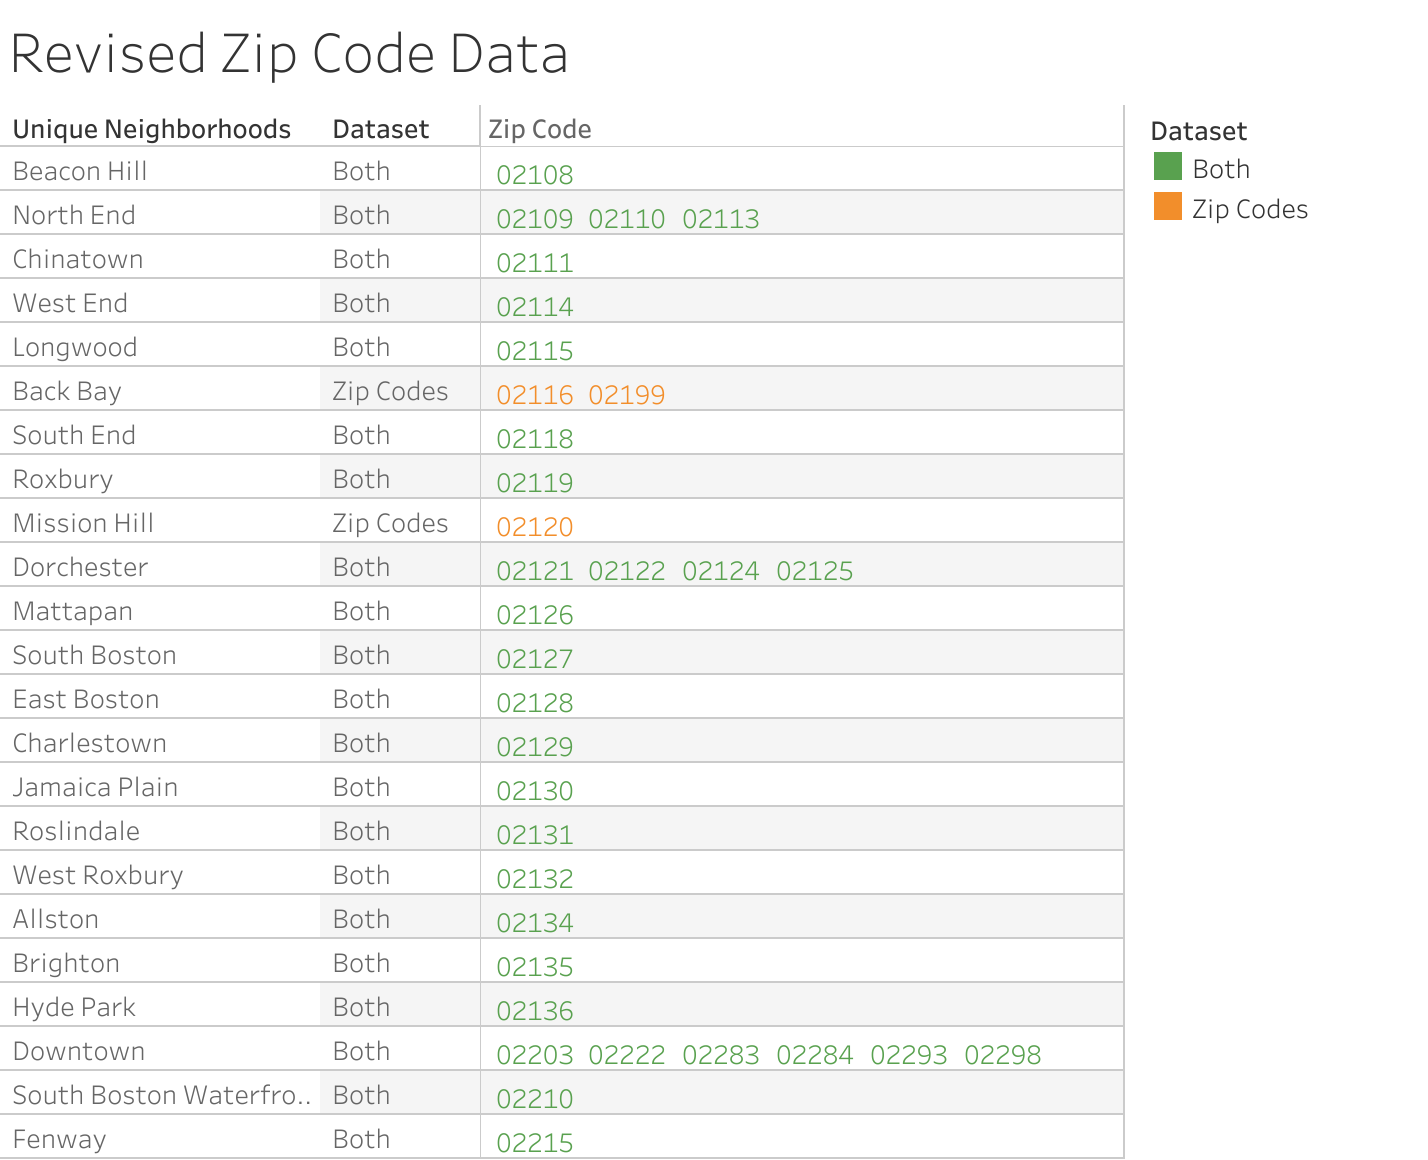
First, the neighborhood zip code data was combined with the main dataset. The figure below illustrates how this relationship was validated using a text table. This revealed that some zip codes were incorrectly classified as 'Downtown', and some neighborhoods were only represented in one of the two datasets (e.g. the West End was recorded in the main dataset but did not correspond to any zip code). Using online information about which neighborhoods correspond to which zip codes, the zip code data was revised to correct these errors and ensure geographic visualizations remain accurate.
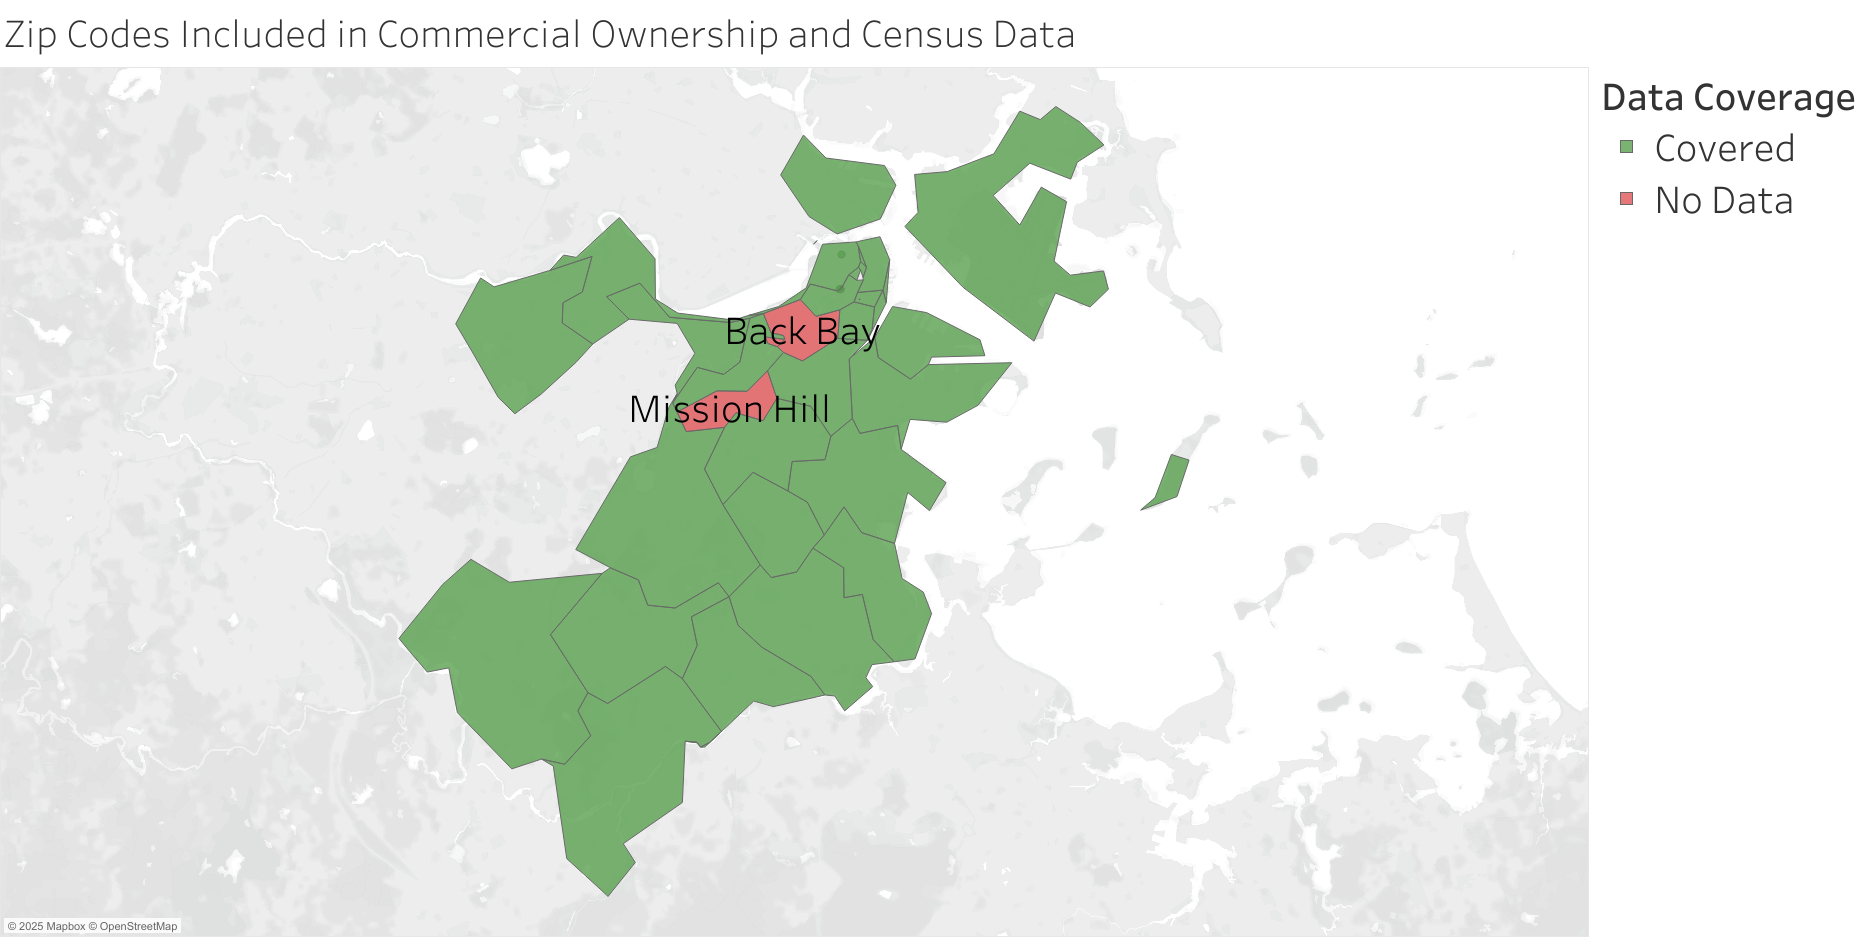
Back Bay and Mission Hill neighborhoods do not correspond to data in the main dataset. This could be because the neighborhood data is based on 2020 census block groups, while the main dataset goes back to 2004 and neighborhood definitions may have changed over time. In some property assessment metadata (Boston Government, 2004-2024), Back Bay is associated with Beacon Hill, and Mission Hill is associated with Jamaica Plain, although it is unclear if the corresponding data has been aggregated into other neighborhoods. Back Bay and Mission Hill shall be excluded from geographic visualizations. Since the zip codes around those neighborhoods are included in the dataset, this shouldn't reduce the insights we can garner.
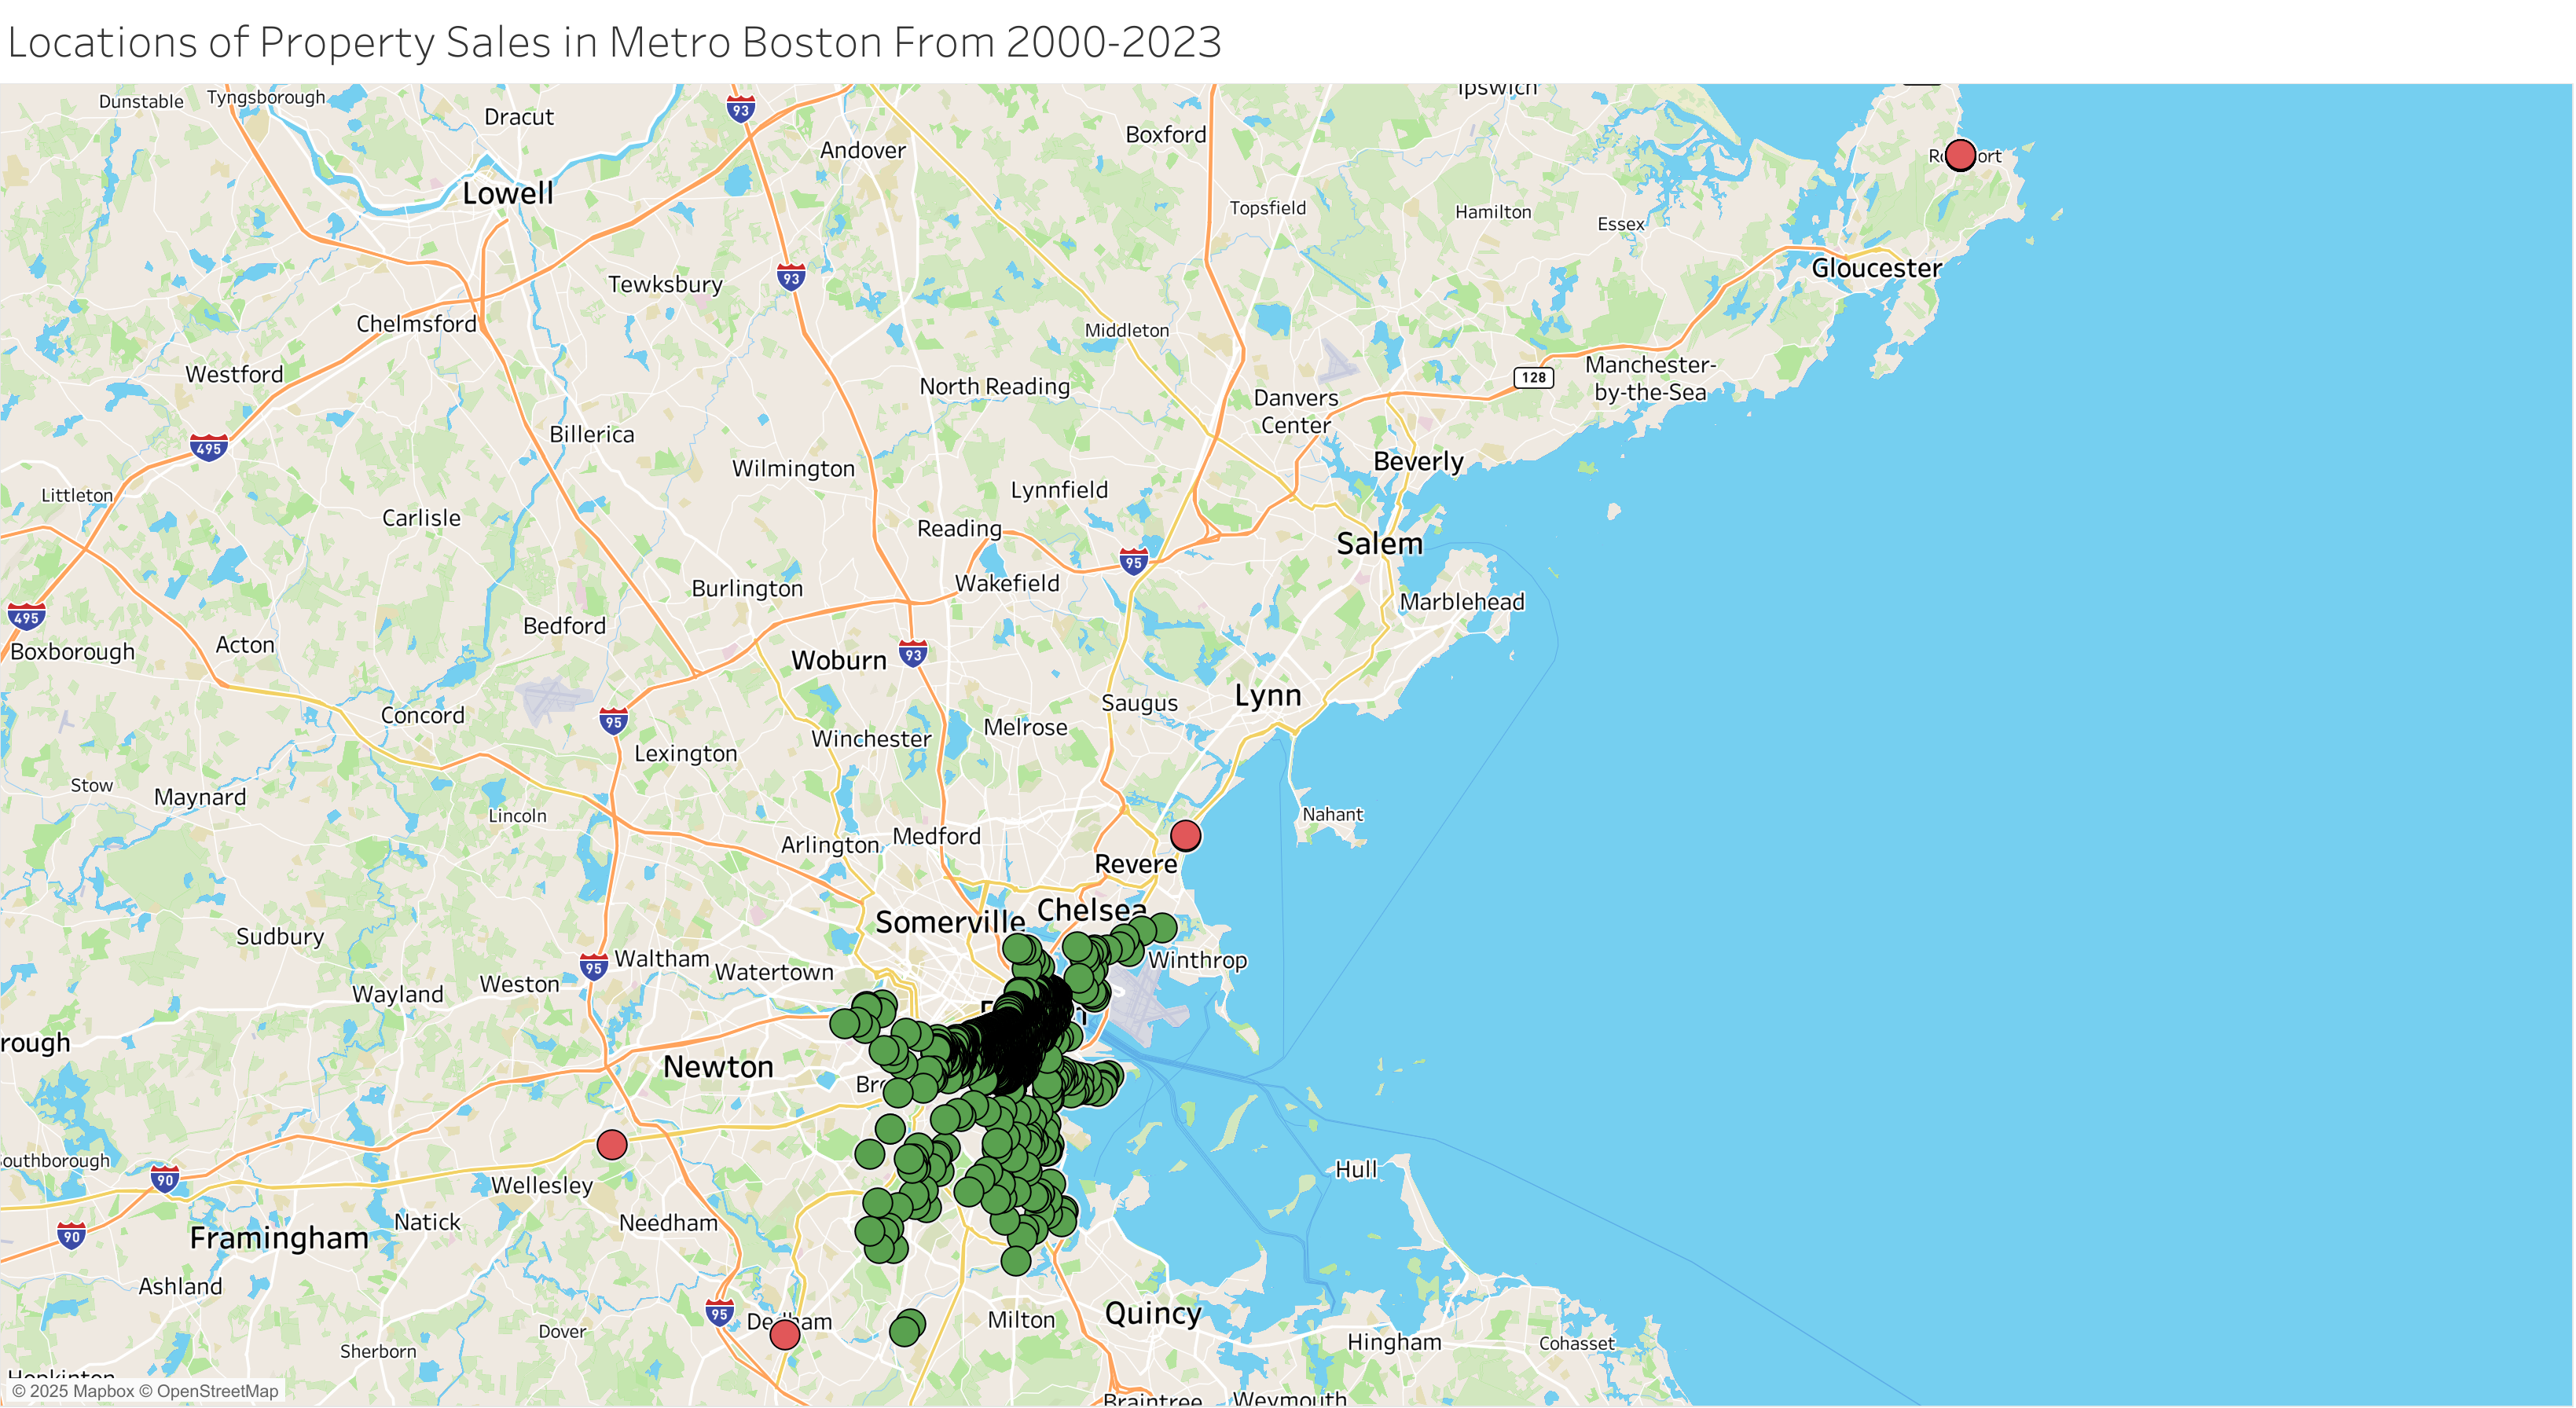
The figure below illustrates which geographic areas are covered by this dataset and highlights the 'missing' neighborhoods. Central Boston is close to the North East extreme of the data set, which does not contain data on other surrounding cities including Cambridge and Somerville. Subtle green spots near the downtown region indicate zip codes that correspond to specific points, such as 02283. These are included in the Downtown neighborhood for the purposes of data analysis, as their locations lie within Downdown regions.
Dataset 1 Processing:
1. Reassigned zip codes to correct neighborhoods: 02109 02110 02113 (North End), 02114 (West End), 02199 (Back Bay), 02215 (Fenway).
2. Removed zip codes 02116 and 02120 (for spatial analysis only).
Property Data
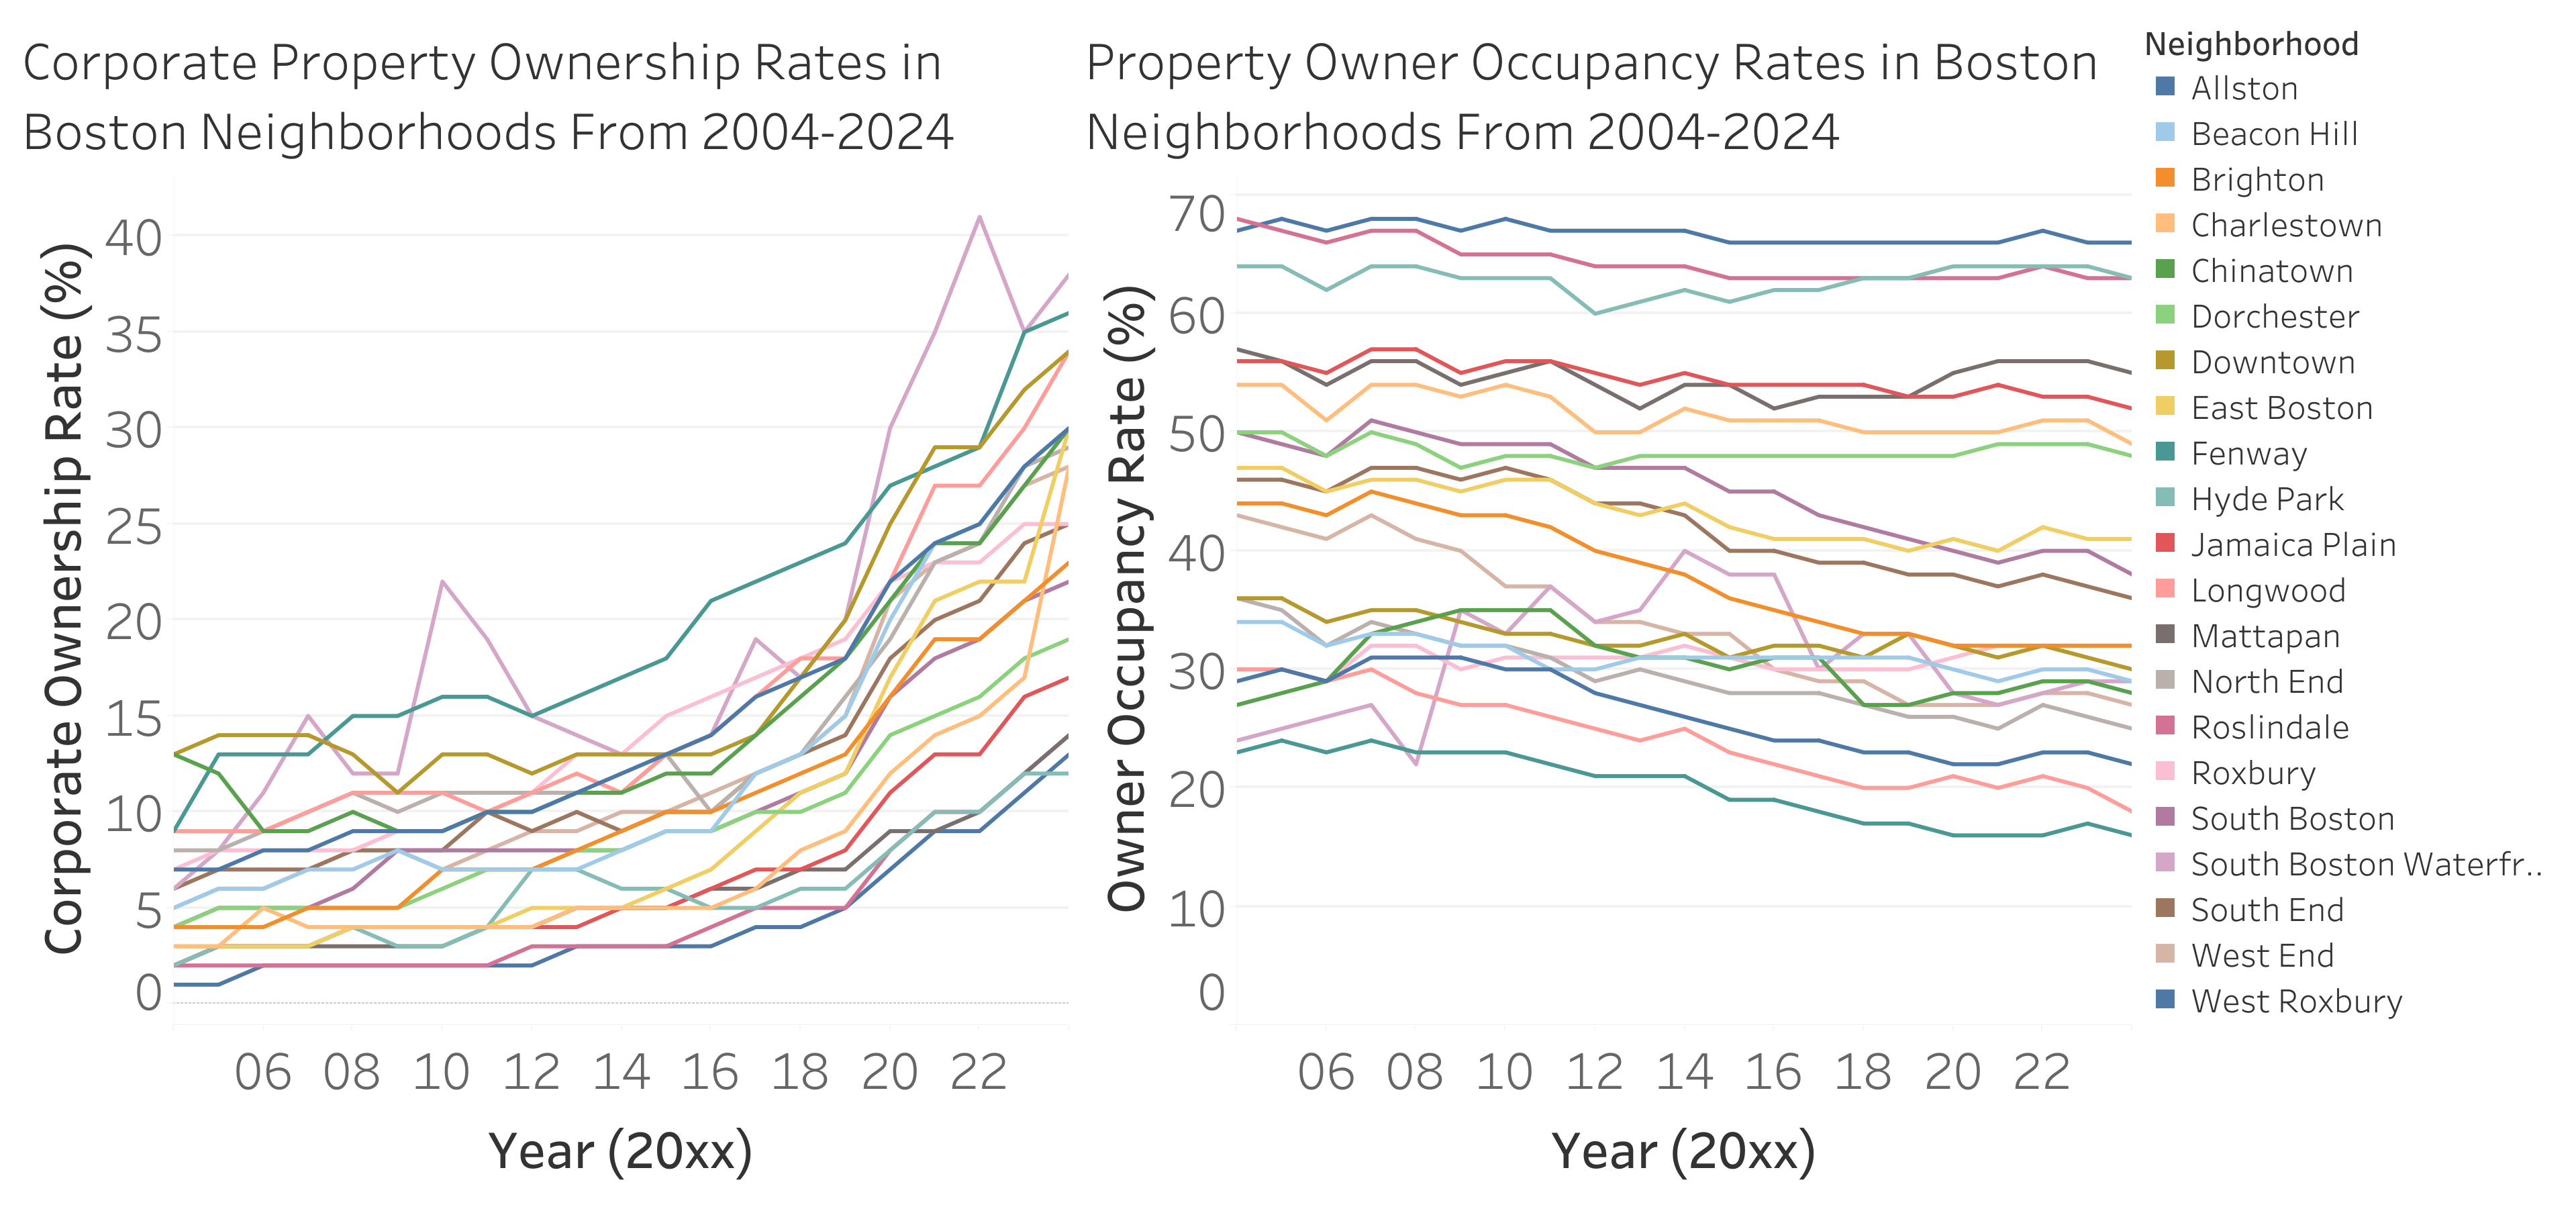
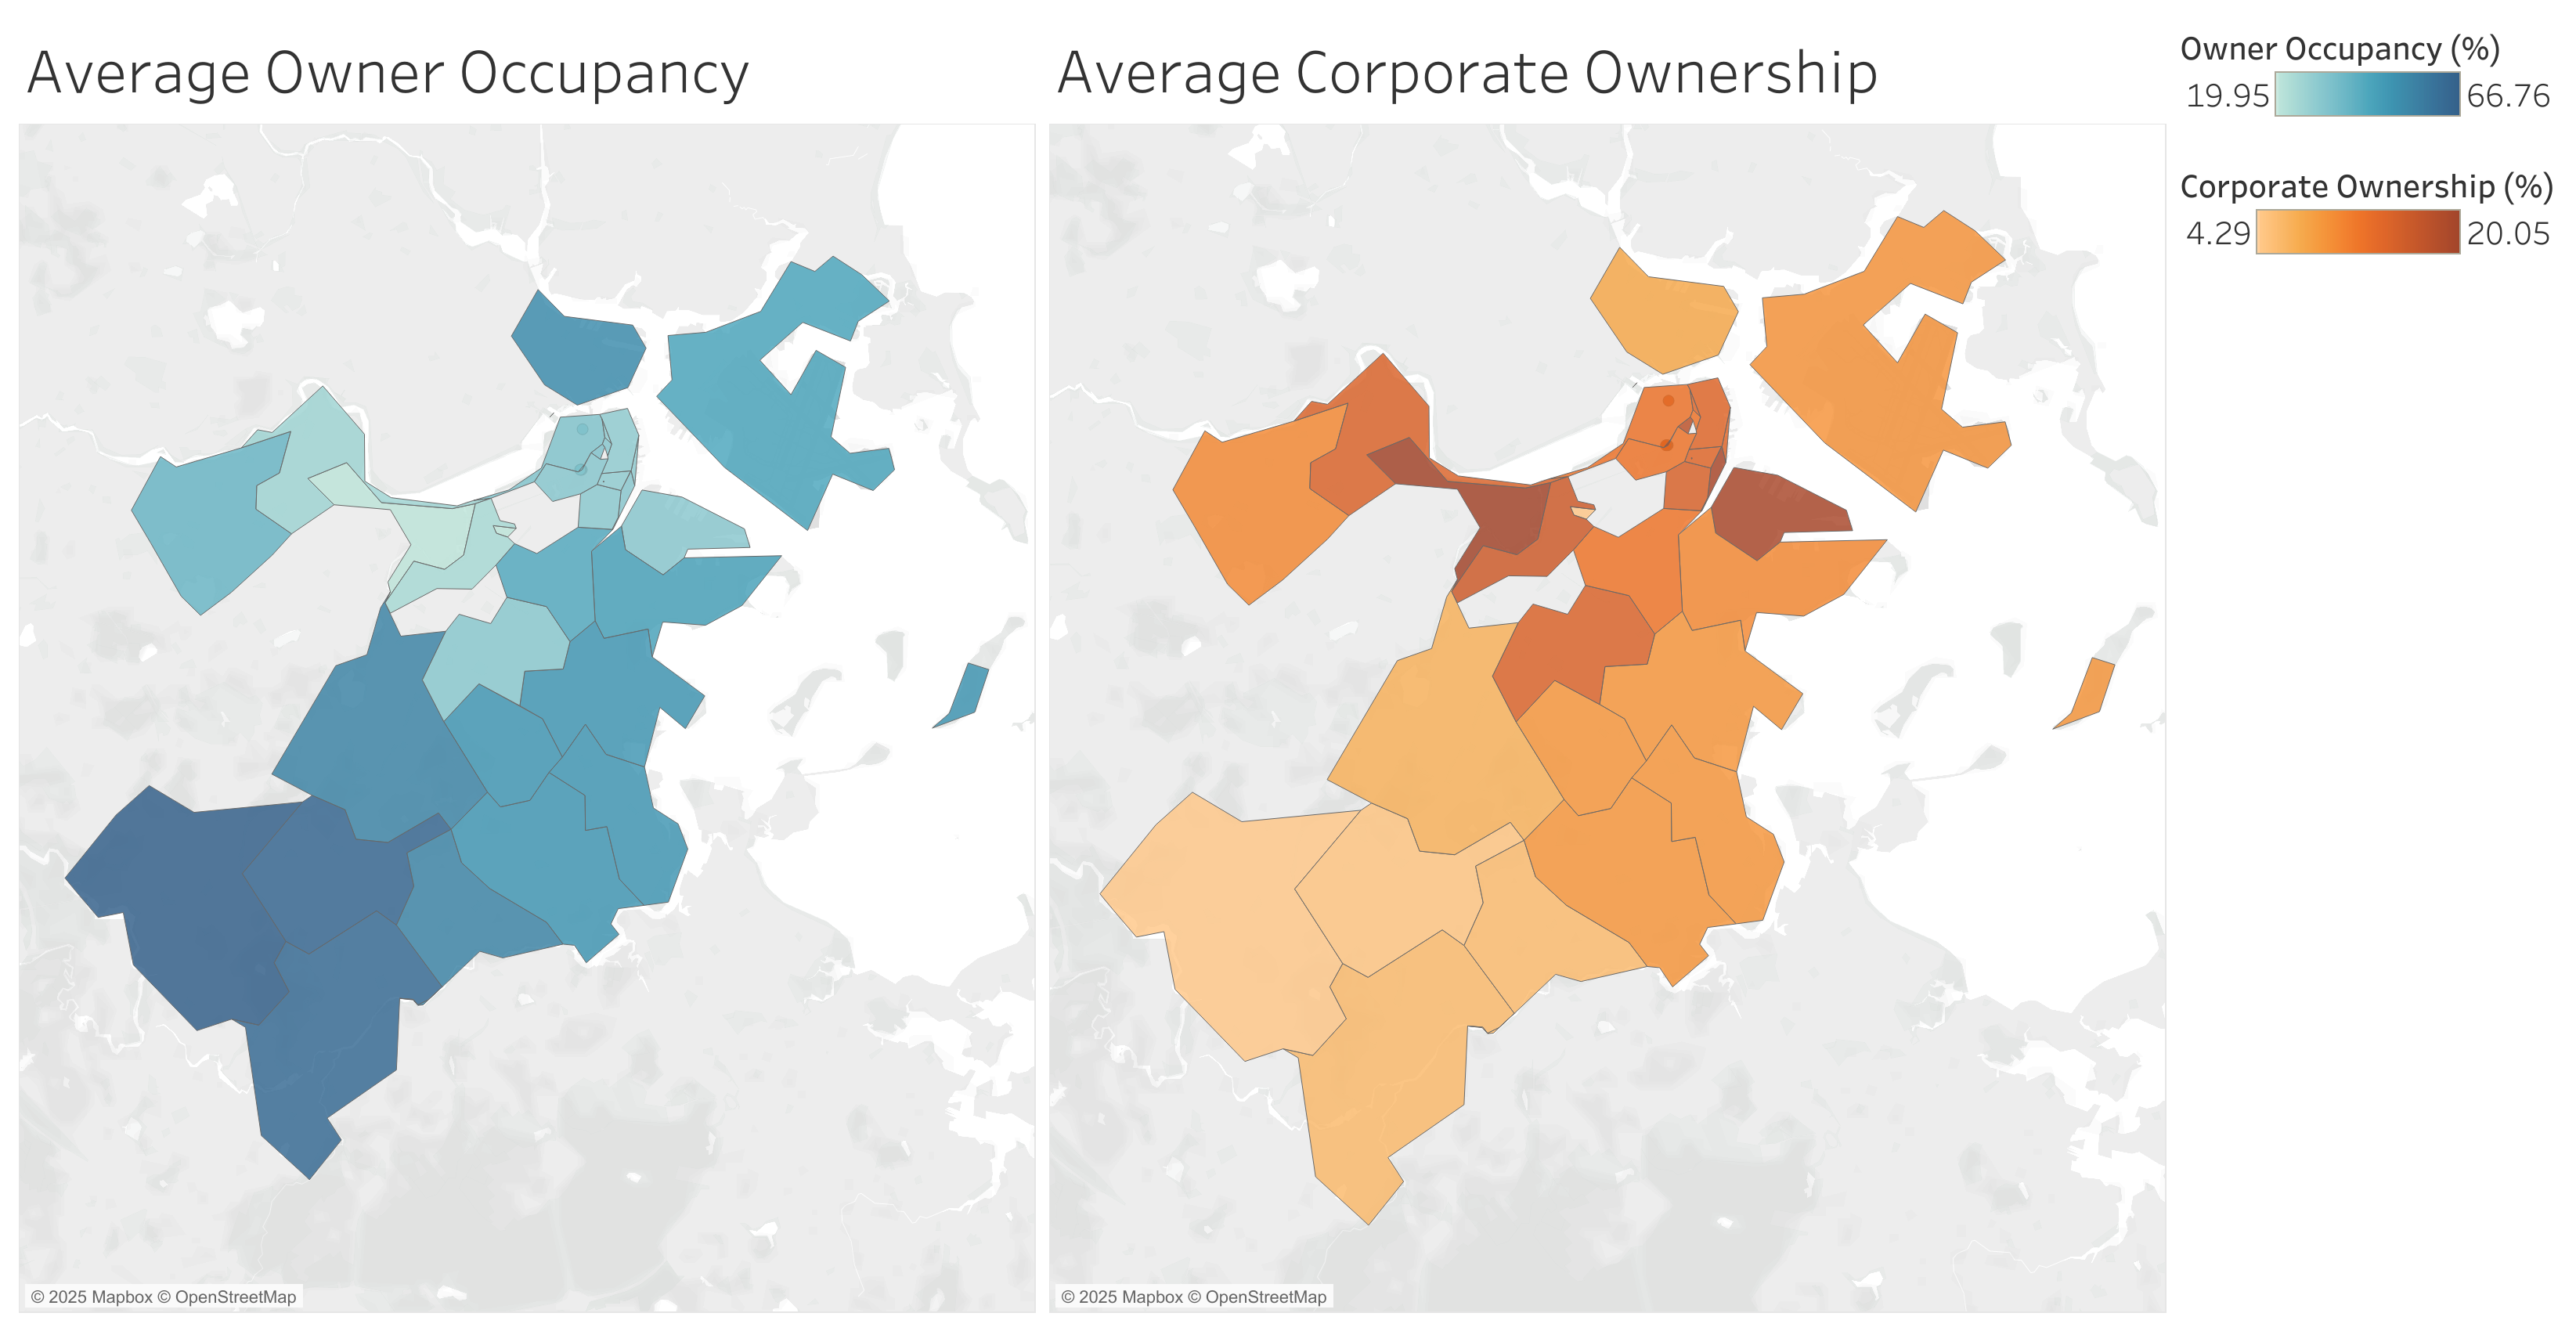
Property data in this dataset is represented in the corporate ownership and owner occupancy rates. The figures below illustrate the data for these metrics in each neighborhood. This validates that the data is present as expected, and values are reasonable. Over time, corporate ownership has increased across all neighborhoods, while owner occupancy has slightly decreased. As expected, corporate ownership rates increase closer to the city center, while owner occupancy decreases.
Dataset 1 Processing:
3. Multiplied occupancy and ownership rates by 100 for improved redability as percentages.
Census Data
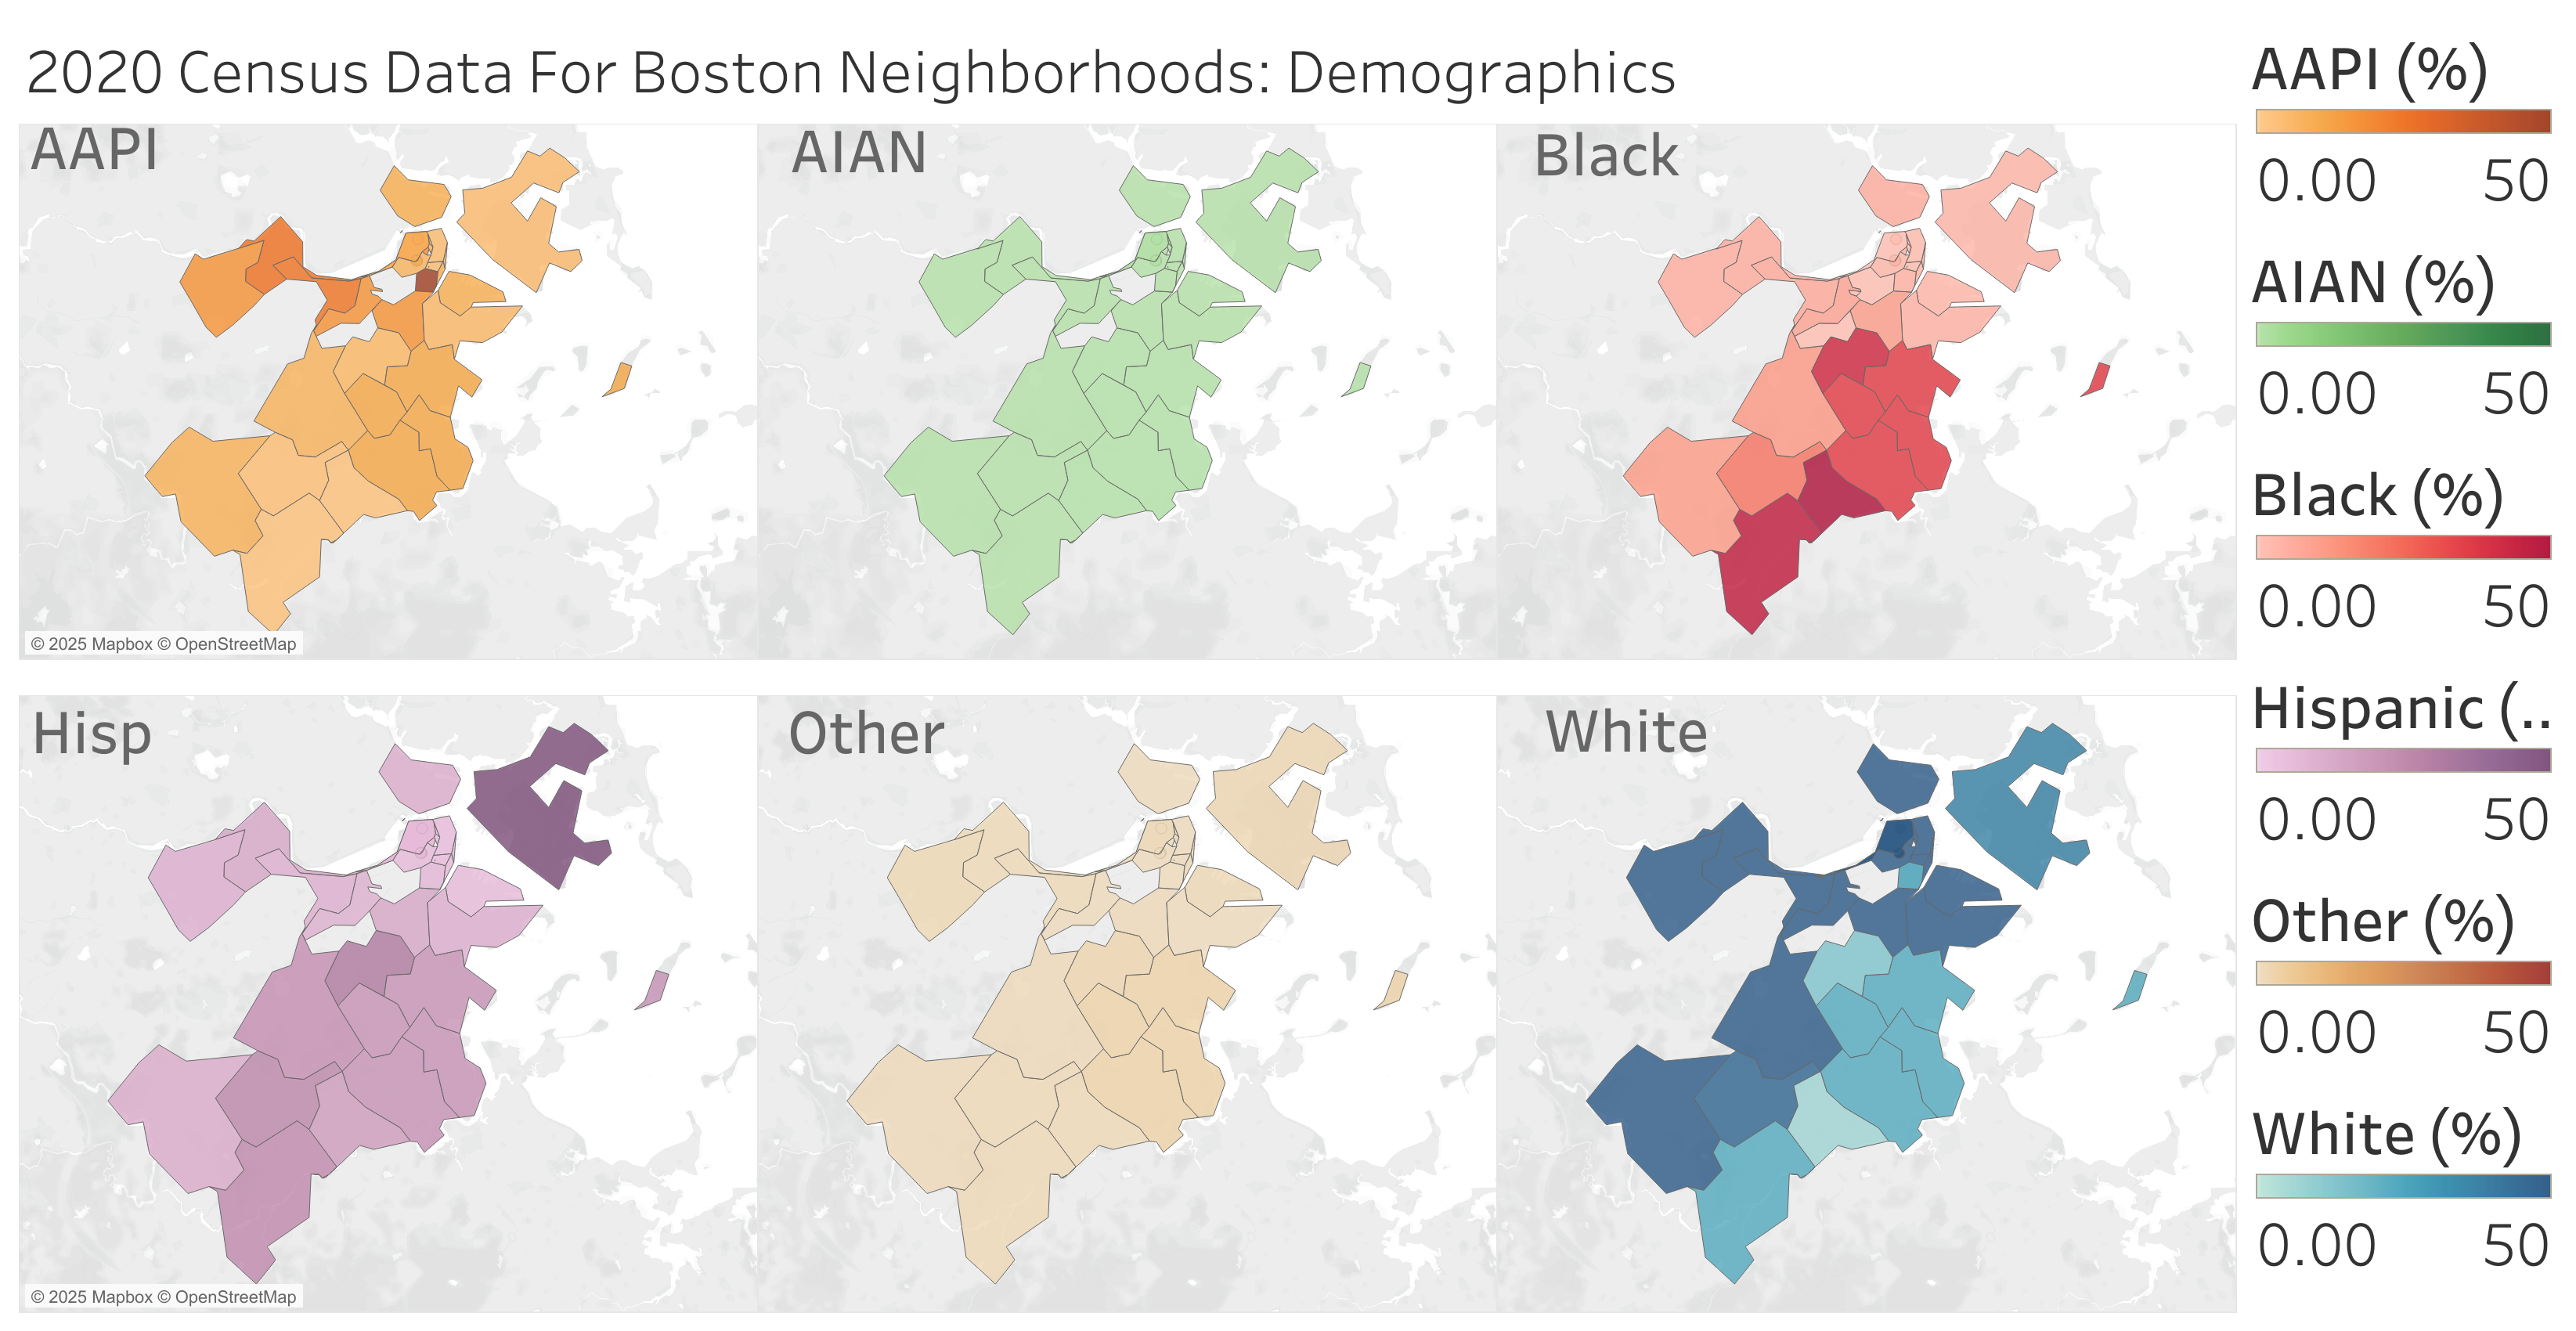
Finally, for dataset 1, the 2020 census data was validated using the figure below. Each census variable is defined in each neighborhood; the figure below illustrates ethnicity data but other metrics were also tested. This validates that the census data is defined in each neighborhood, and values are again reasonable. Nothing unexpected stands out from the census data, and it is easy to identify which demographics dominate in each neighborhood. By dividing by the total population in each neighborhood, it was easier to assess the distribution of demographics, since the raw values are weighted by total neighborhood population.
Dataset 1 Processing:
4. Divided population data by total population in each neighborhood to attain demographic data as a percentage of total neighborhood population.
Dataset 2: Residential Sales Data in the City of Boston, 2000-2023 (The Warren Group, 2025)
Metadata
The metadata for this dataset describes each of the variables; there are many variables and not all of them are relevant to this analysis. Most of the variables will be considered for the purpose of validating the dataset and identifying spurious entries. Unlike the first dataset, it will be shown that this dataset contains substantially more spurious entries, requiring much more cleaning up. Some variable descriptions are vague.
Geographic Data
Plotting the position of each sale, it was apparent that 89 entries were located at 'null island' with a grid position of (0,0). On inspection, all of these properties corresponded to the 02205 zip code, which is a zip code associated only with PO-boxes (so it does not correspond to a physical location). Filtering by the 02205 zip code, several properties were identified with incorrect locations around the Boston area (on streets that did not match the recorded street name). Since it would be difficult to re-locate these points, they shall be filtered out for all spatial analysis. The data for these properties is still valid for analyzing non-geographic information, so they shall be included whenever physical location is not important.
When plotting the location of each property, it became clear that some recorded zip codes do not match the actual property location. For example, the 02115 zip code is assigned to many properties in Back Bay, but those properties are actually located in the 02116 zip code. This is probably caused by changes in zip code allocations over time. Therefore, zip code data shall be ignored in favor of actual latitude and longitude positions when analyzing spatial data in this dataset.
Other erroneous locations were also identified. These were more difficult to accurately re-locate, so they will be filtered out when analyzing spatial data (again, these points do not need to be excluded when considering other, non-spatial data). Their data will still be included when evaluating other trends in the data:
- Union Park: 3 records were present on this street, but their location was incorrectly recorded in Rockport.
- Carver Street: 2 records were present on this street, but their location was incorrectly recorded in Wellesley. Carver street is actually located in Cambridge, not Boston, so these records were filtered out from all data analysis.
- Some on Bay State Road: One of the records associated with this street was incorrectly located in Revere.
- Some properties built before 1901: 107 records of properties built before 1901 were incorrectly located in Dedham. Fanueil Hall was also found to have a 'year build' recorded as 1990, but it was actually built in 1742. The building underwent major renovations in 1990, so these records are likely to be associated with those renovations.
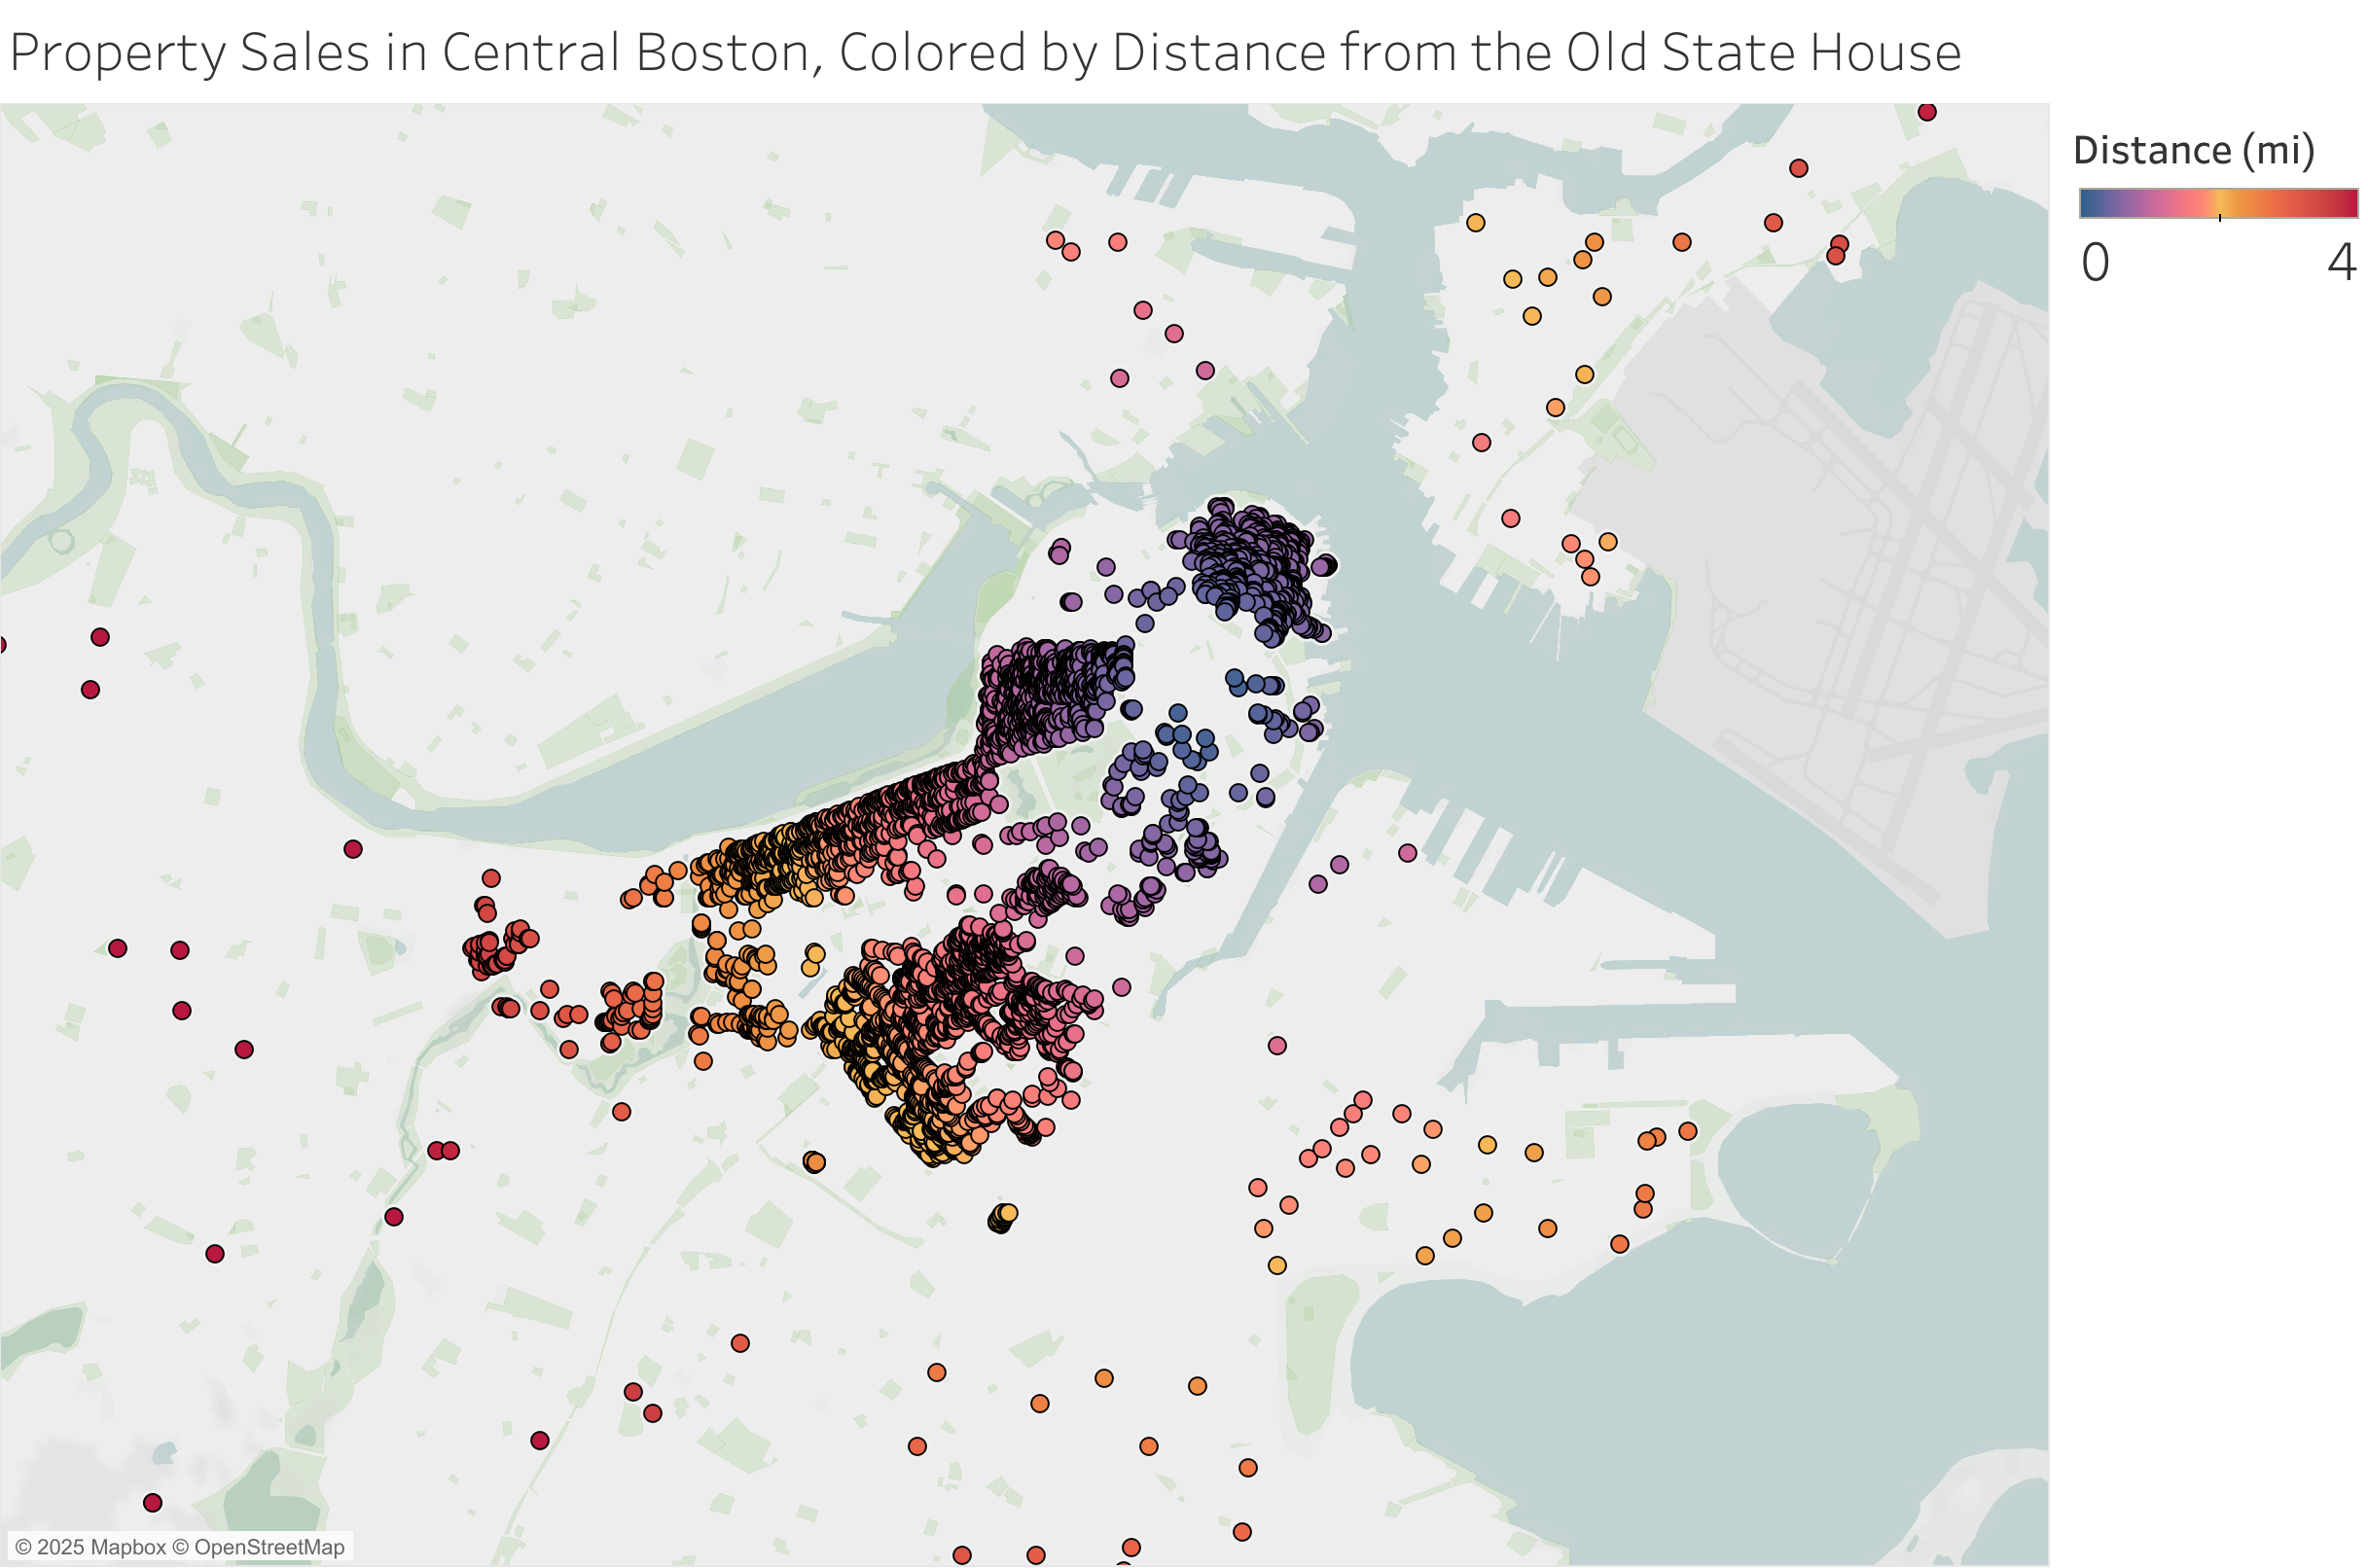
Since zip code data is unreliable, an alternative method for aggregating properties by location uses the distance from each property to the Old State House, which is a representative point in central Boston. This distance was computed for each property and will be used in the targeted investigation to explore how different metrics change as properties move further away from the city center.
Dataset 1 Processing:
1. Filter out properties with 02205 zip codes (for spatial analysis only).
2. Neglect zip code data for spatial analysis, since values are unreliable.
3. Filter out other incorrectly located properties (for spatial analysis only, see list above).
4. Be aware that the dataset appears to be incomplete outside of central Boston (for spatial analysis only).
5. Compute distance (as the crow flies) from Old State House for each property, as an alternative to unreliable zip code data.
Property Data
The property sales records, as expected, are extremely messy and contain many spurious entries. By examining different variables, many of these discrepancies could be removed, although this brief analysis is unlikely to have completely cleaned the data. We shall begin by exploring data about the properties, and then explore data about the parties involved in each sale. We shall focus on metrics that are most closely related to the prelimnary questions, so not all variables will be discussed here (specifically, we shall ignore data related to flipping, which is different to speculation).
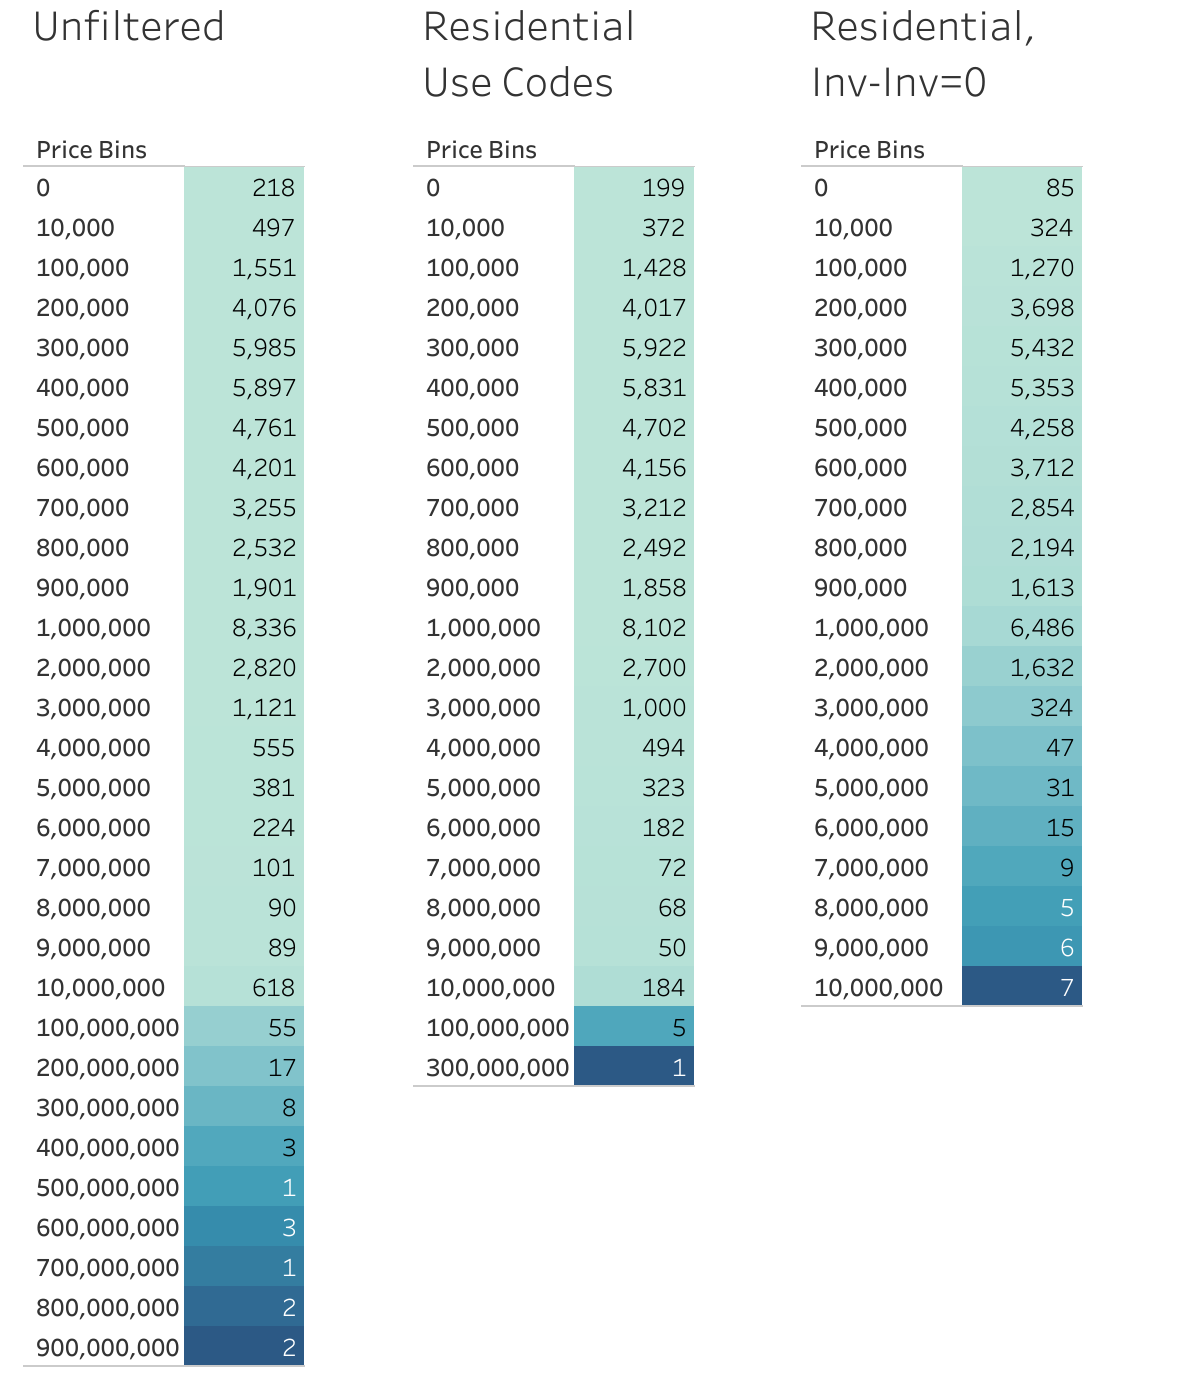
The figure below was useful for identifying spurious price data. The property sale prices were separated into groups; all sales prices were greater than or equal to $1. At the high end, several properties had values exceeding 100 million dollars; these were associated with the purchase of office buildings and investor-investor sales of entire condominiums. Since these sales are somewhat independent of specualtion, they can be filtered out, leaving a more reasonable maximum price of $38,5990,000 which is a verifiable sale of a residential property at 5 Commonwealth Avenue (Remax, 2025). The high-value sales were filtered using two metrics; only residential-associated use codes were included (these were manually selected; the majority of remaining properties had codes 101-105 which correspond to family residences and condominiums) and investor-investor sales were excluded.
As well as reducing the number of extremely high-value records, removing investor-investor sales also reduced the number of extremely low-value records. Many of these were 'sold' at a value of $1, suggesting that the records corresponded to a change in ownership without a sale. However, 409 filtered records still had a price below $100,000; for example, 425 Newbury Street A22, which is a parking space (Zillow, 2025). Since many of these low-value properties are unlikely to represent a 'true' property sale, they should be filtered out. It is difficult to find the optimal method for filtering these values out, since apartment prices two decades ago could be lower than parking space prices in 2022. With some experimentation, it can be seen that most of the properties between $10,000 and $100,000 were sold in the earlier years of the database. By contrast, many properties below $10,000 correspond to parking spaces and other non-residential property. Therefore, an additional filter will be applied to remove properties with a sale value below $10,000.
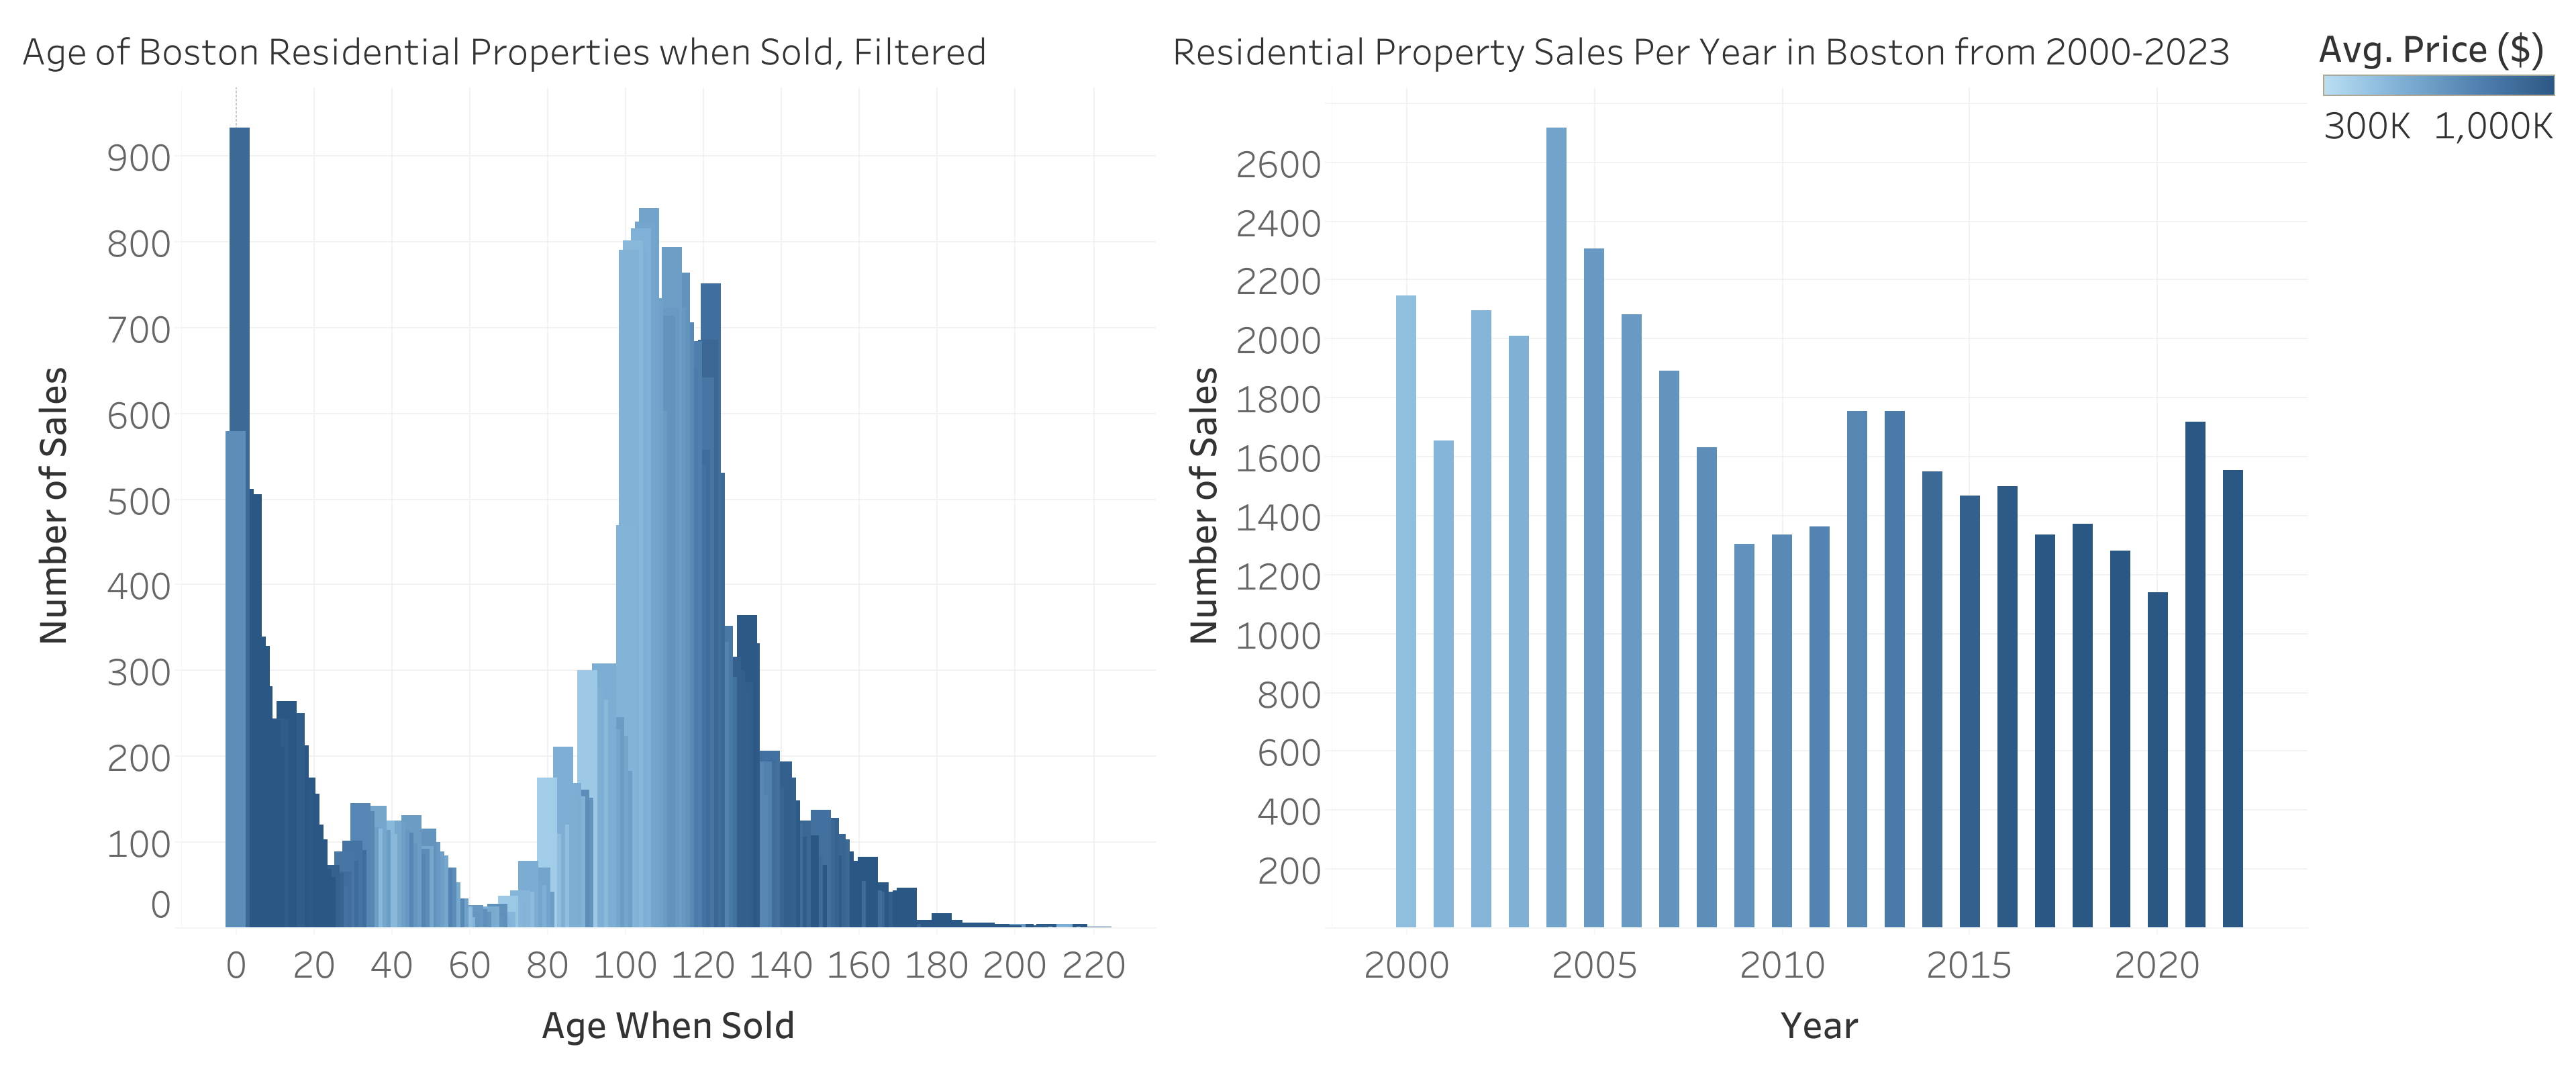
Two important dates are the year a property was built, and the year of its sale. The sale dates all lie between 2000 and 2023, as expected. However, year of construction data has unexpected features:
- 1369 records have a 'year built' of 00, suggesting that the year of construction is unknown. These records will be filtered out when considering year built data.
- There is a significant peak at 1899, which can be explained by the 1899 adoption of the Torrens system, which led to many properties being registered in that year; this is the reason that records of many old properties in Boston only go back to 1899. (Buscher G, 2014)
- The number of properties built each year also peaks every 10 years suggesting that, in many cases, only the decade of construction is known, rather than the exact year.
- In 808 cases, the 'year built' is later than the year of sale; these records correspond to properties that have been renovated since their sale and the renovation dates have been recorded under 'year built'.
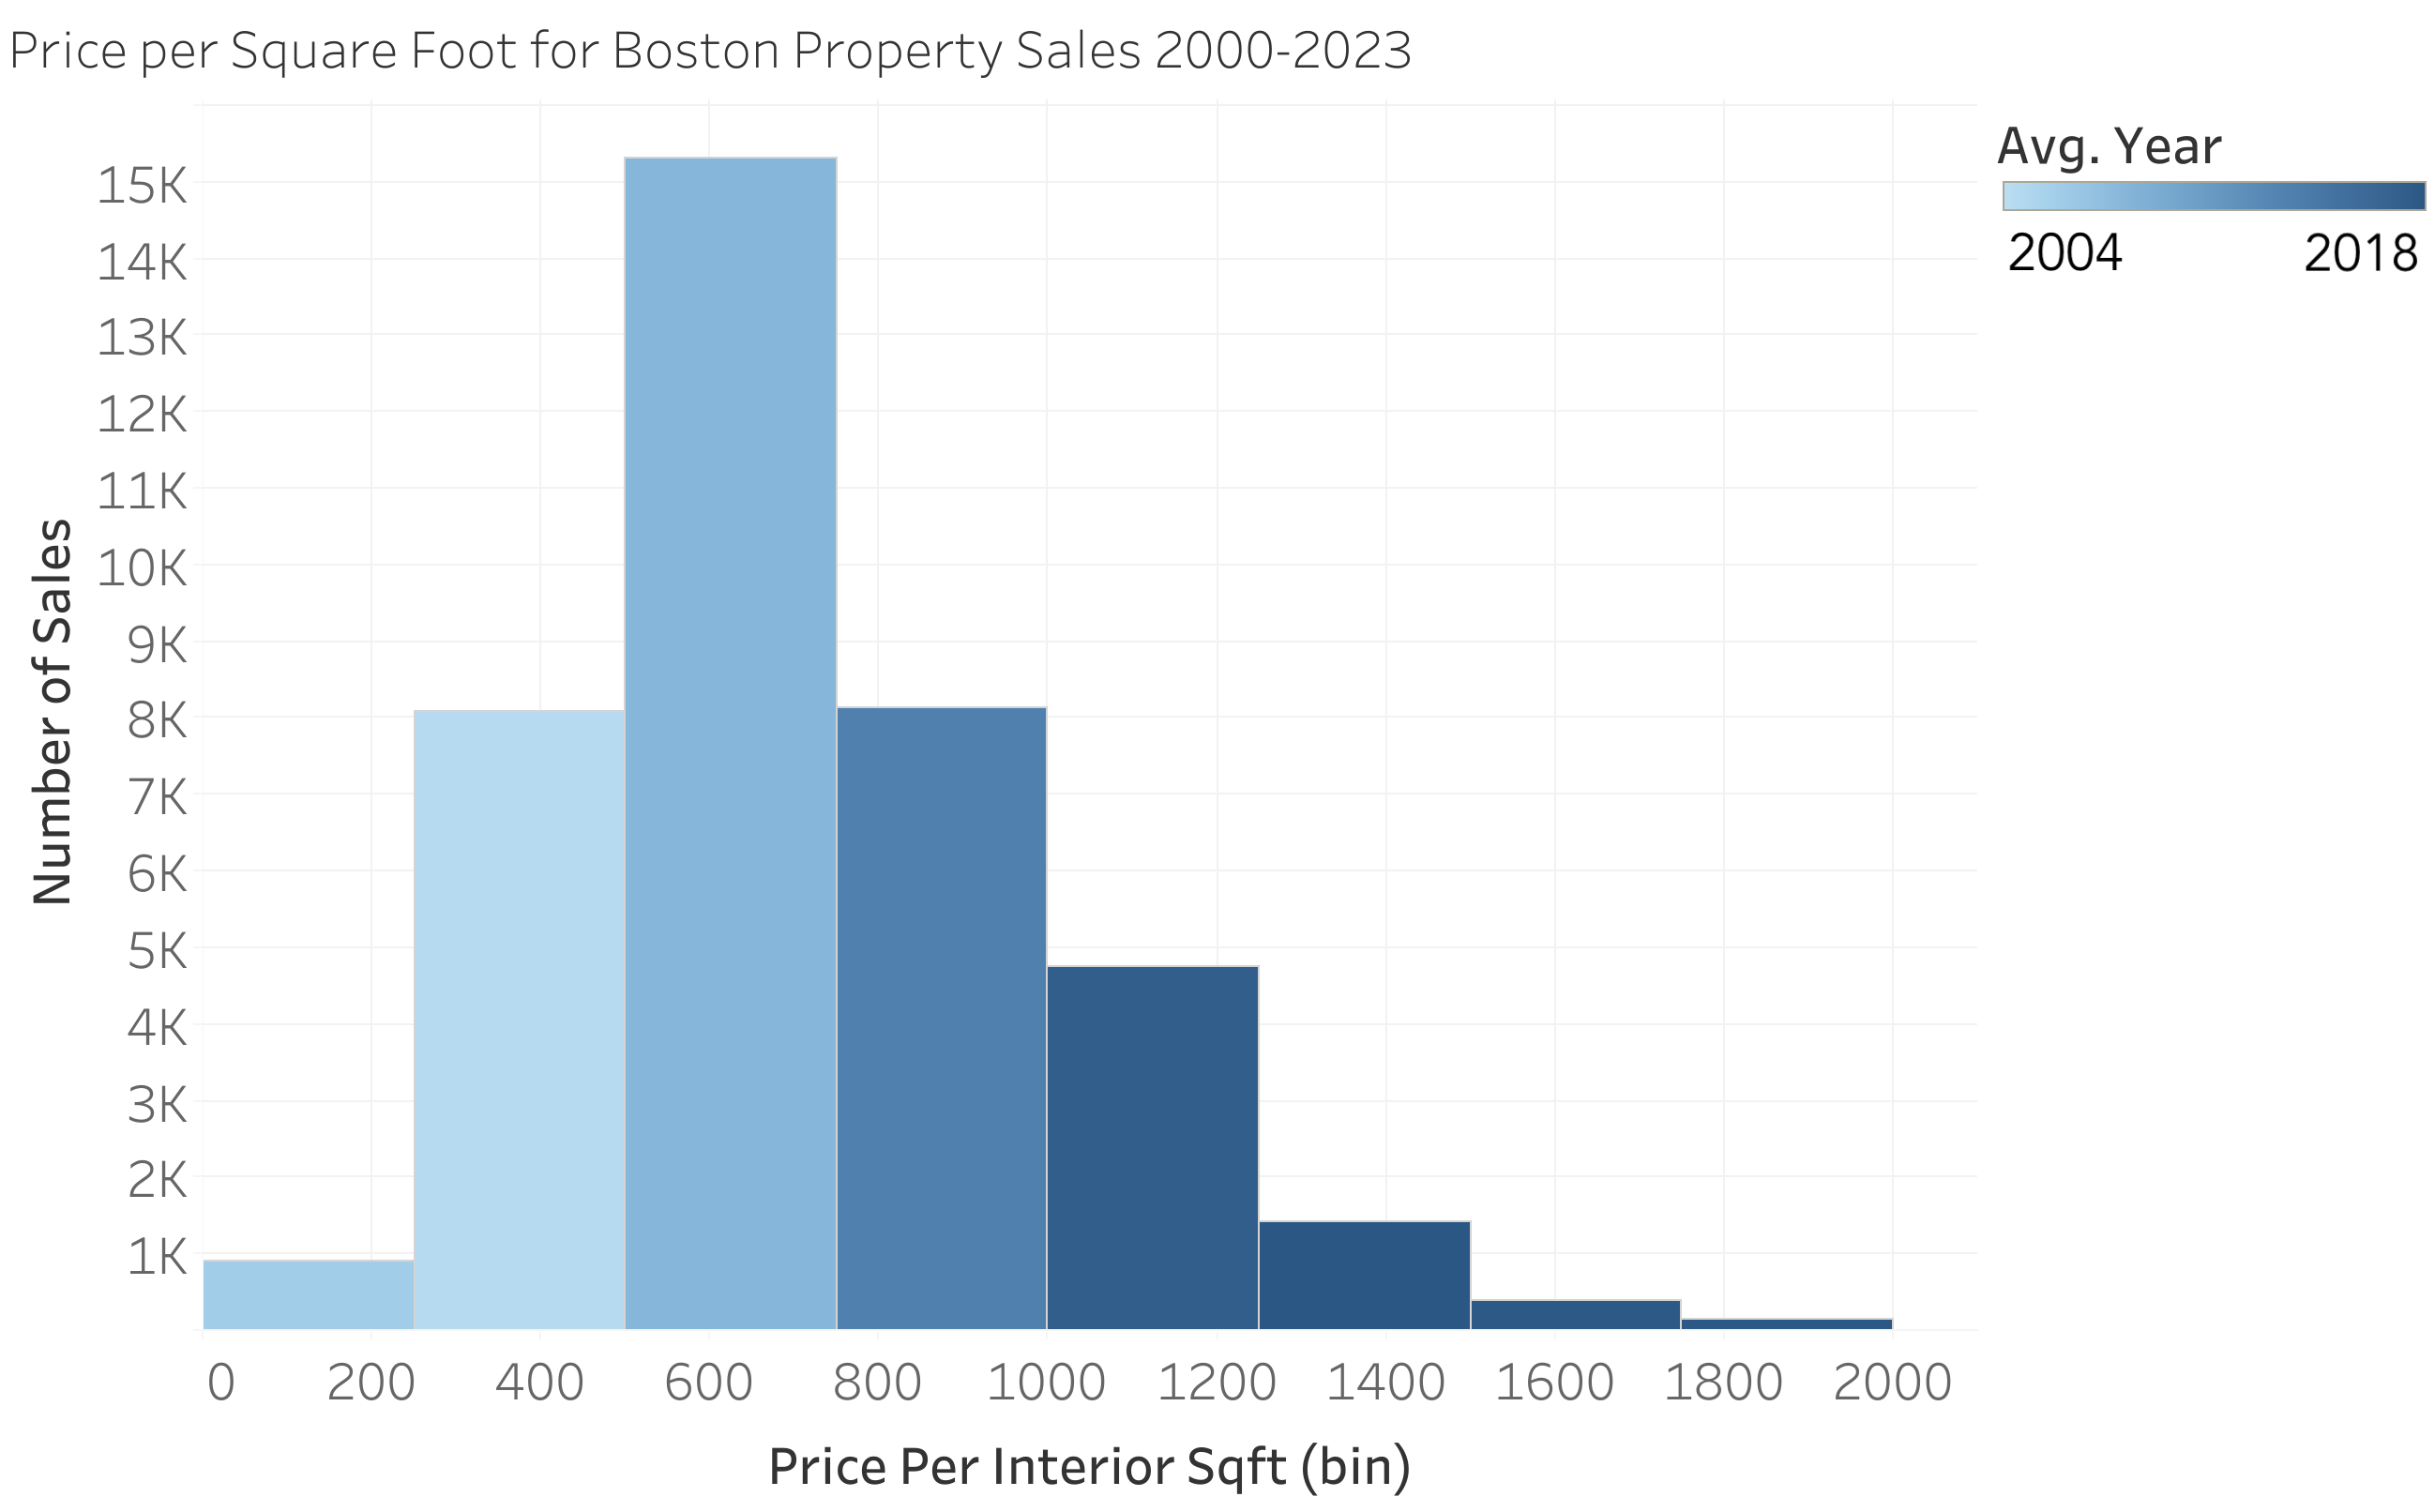
Data on the internal floor area of properties required cleaning up; 4 values were zero (suggesting that the area was unknown, or the property was not enclosed like a parking space). Dividing property price by the internal area produces a 'price per square foot' value; this parameter revealed some properties with spurious values, up to $7,333 per sqft in the case of a $1.1 million property with an, evidently incorrect, floor area of 150 sqft. Grouping the price per square foot into $250/sqft size bins, and filtering out bins that contain less than 100 records, we can product the figure below. This fits the expected normal distribution, and color shading again shows how the price per square foot has increased over time. Analysis of the filtered properties with abnormally high prices per square foot could help to reveal the most high-value properties in Boston, but most of them appear to simply contain errors.
Dataset 1 Processing:
5. Filter out properties with non-residential use codes (leaving usecodes 101-105, and a few others).
6. Filter out investor-investor sales (not relevant to speculation).
7. Filter out properties with sale prices below $10,000 (including parking spaces and erroneous values).
8. Group 'year built' by decade.
9. Neglect properties with a 'year built' after their year of sale (only when the property age is relevant to analysis).
10. Compute price per square foot (and neglect values above $2000/sqft when analyzing this metric).
Stakeholder Data
Many metrics are provided that can help understand the identities and motivations of parties involved in each sale. Based on the preliminary questions, this analysis shall focus on whether the buyer is an investor or a non-investor. The figure below illustrates how the number of purchases vary with distance from the Old State House for investor and non-investor type purchases. Perhaps unexpectedly, the number of investor-purchased properties is substantially lower than the number of non-investor purchases, and the distribution is relatively flat, suggesting that investors are happy to purchase properties up to at least 2 miles from the city center, although this dataset does not include information about sales further away and there is some decrease in investor purchases between 2 and 3.5 miles (although this corresponds to a decrease in total property purchases, likely corresponding to a decrease in property density and the lack of data North of the city).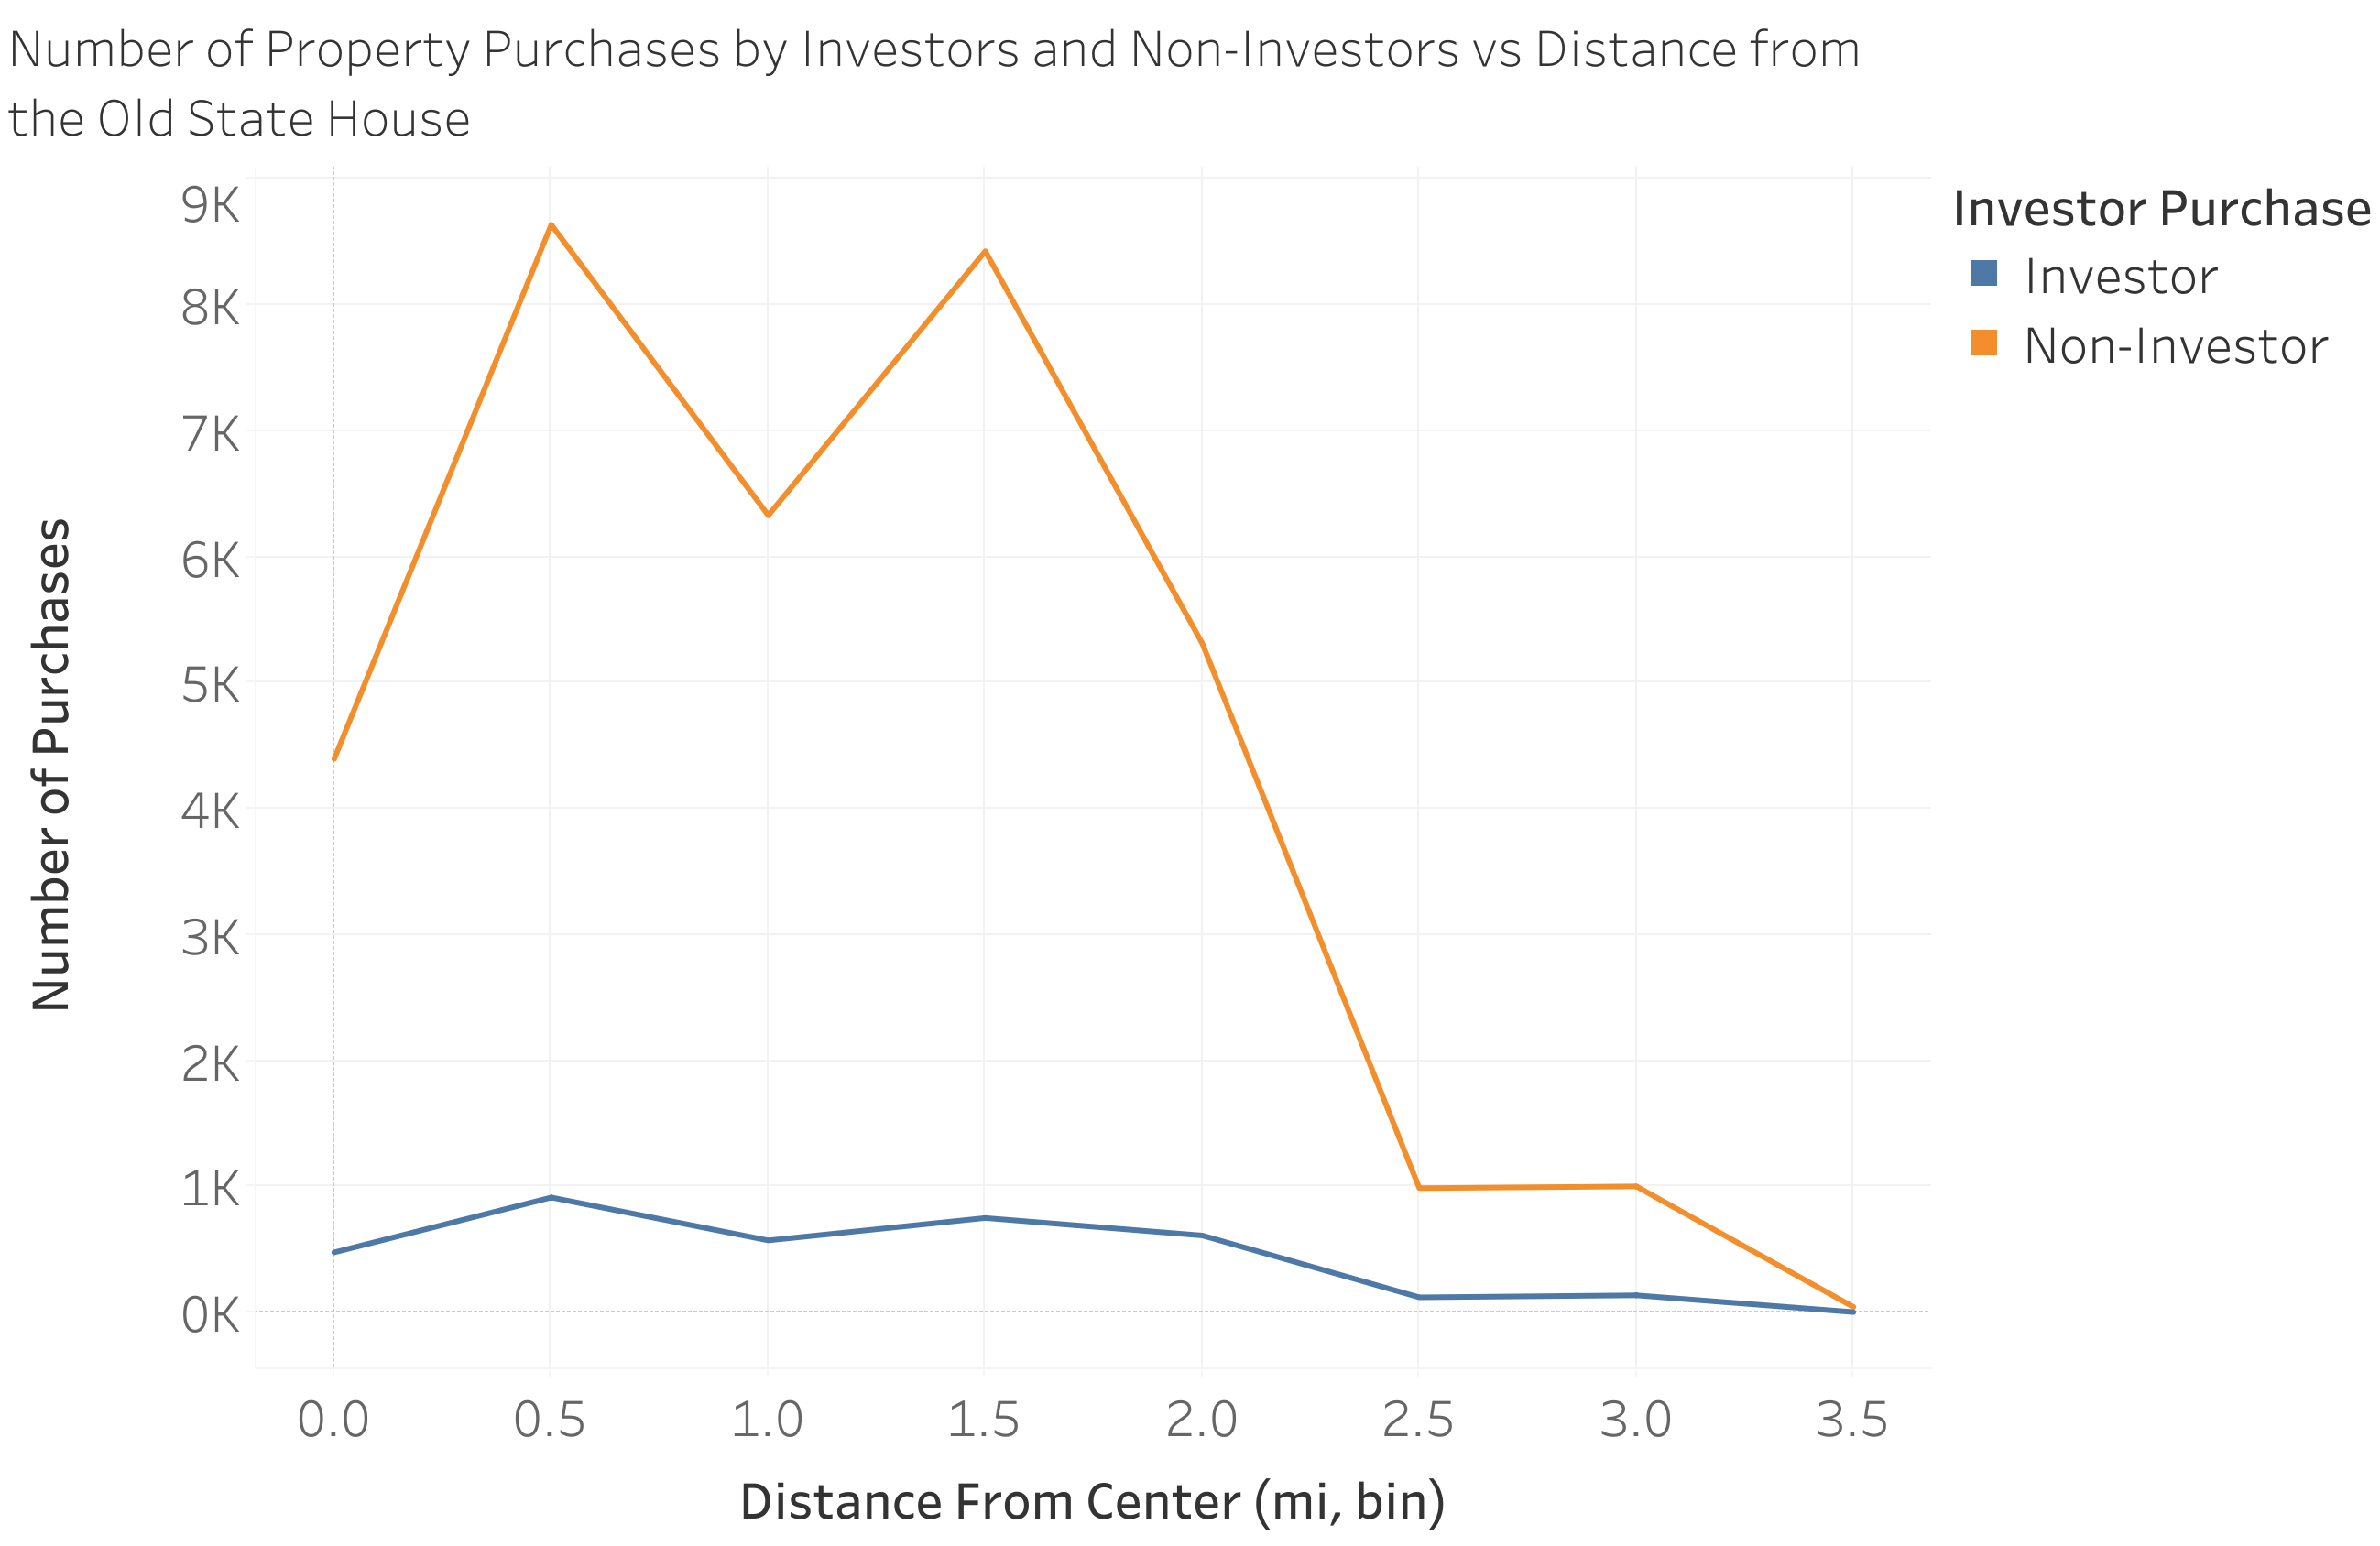
Dataset 1 Processing:
12. Aggregate investor-type data into a binary variables for whether the buyer/ seller was an investor or not.
Stage 2: Targeted Investigation
1. How far-reaching are the effects of speculation? Is it concentrated in Downtown Boston?
We are concerned here with where investors are purchasing properties. Starting with the dataset 1, we can explore corporate ownership rates (as illustrated in the 'overview' section and repeated below) to begin to understand where investors are most active. It is clear from the figure below that corporate ownership is much more prevalent closer to central Boston, with rates nearly 5x higher in the city center than the outskirts. The highest concentrations of corporate ownership are not in the Downtown neighborhood, but in neighborhoods slightly further from the city center.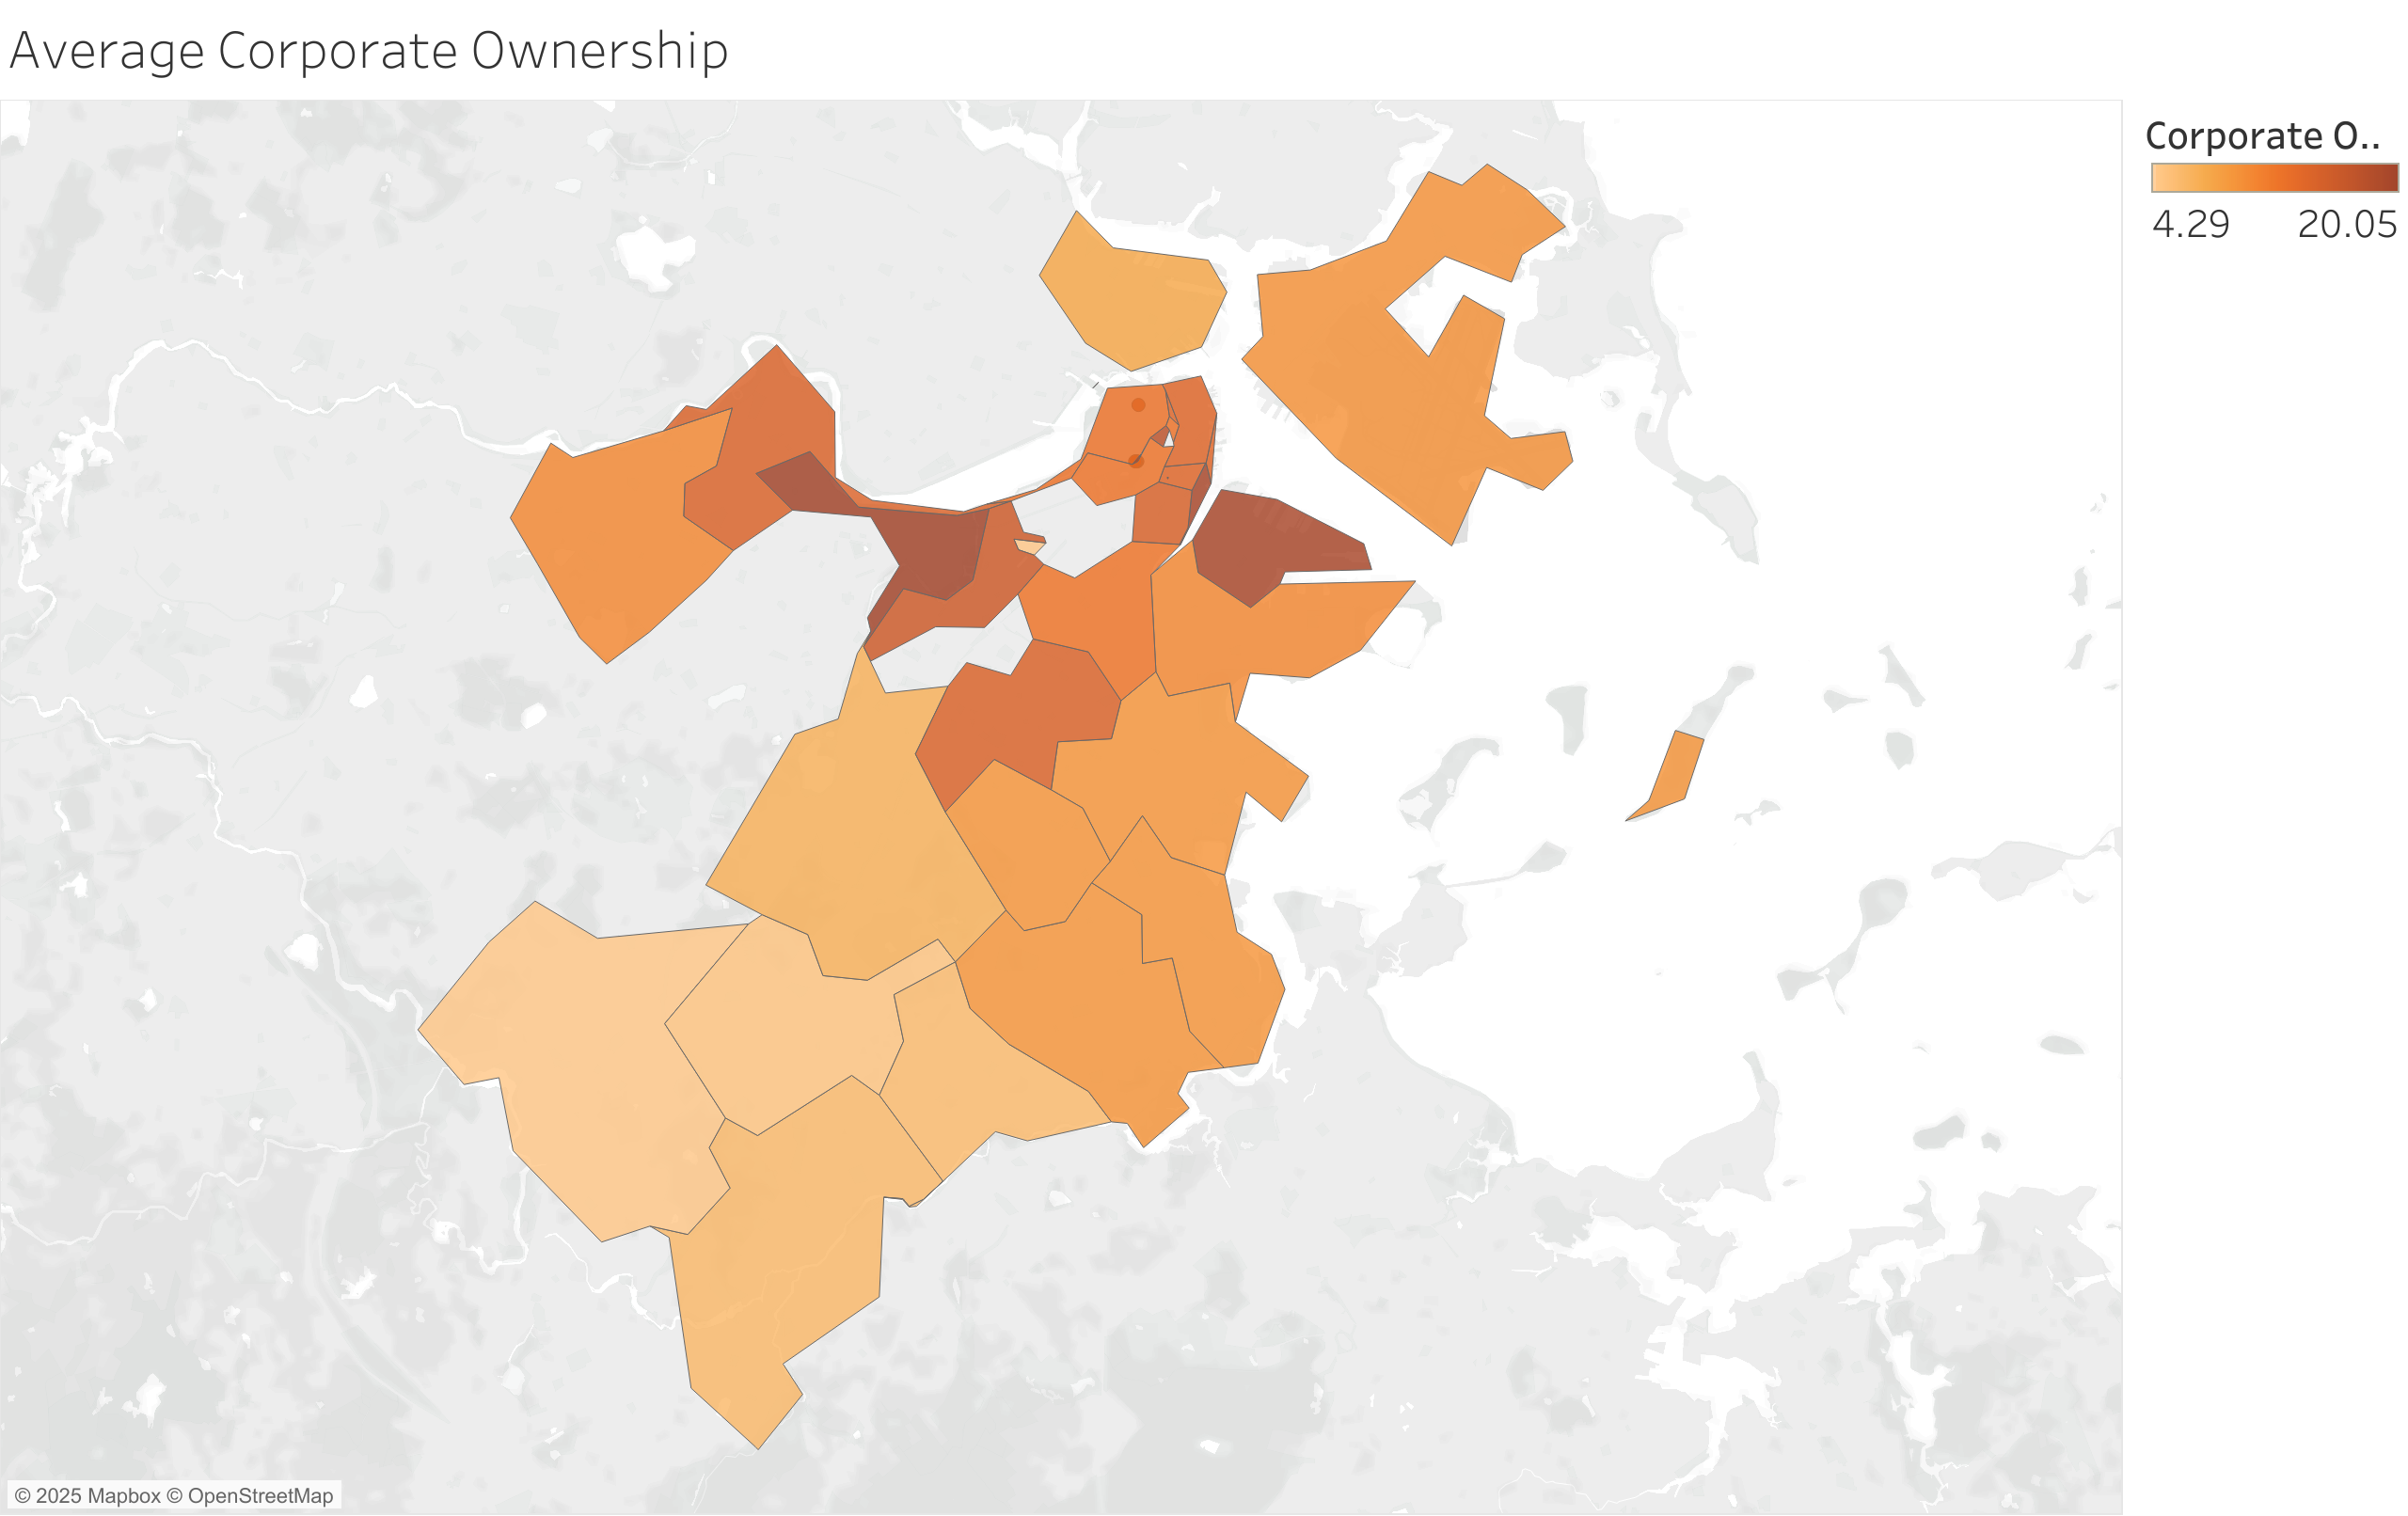
Question 1, Dataset 1 Processing:
1. Apply filtering described in 'overview' section.
2. Multiply corporate ownership rate by 100, to convert into a more readable percentage format.
A follow-up question based on this result is; how have these corporate ownership rates affects property prices in these areas? The two datasets used in this analysis do not contain sufficient information to address this follow-up question (since price data is only available for the most central neighborhoods). However, as we explored in the 'overview' section, corporate ownership is inversely related to owner occupancy, suggesting that corporate ownership does affect the ability of local residents to purchase property in a neighborhood.
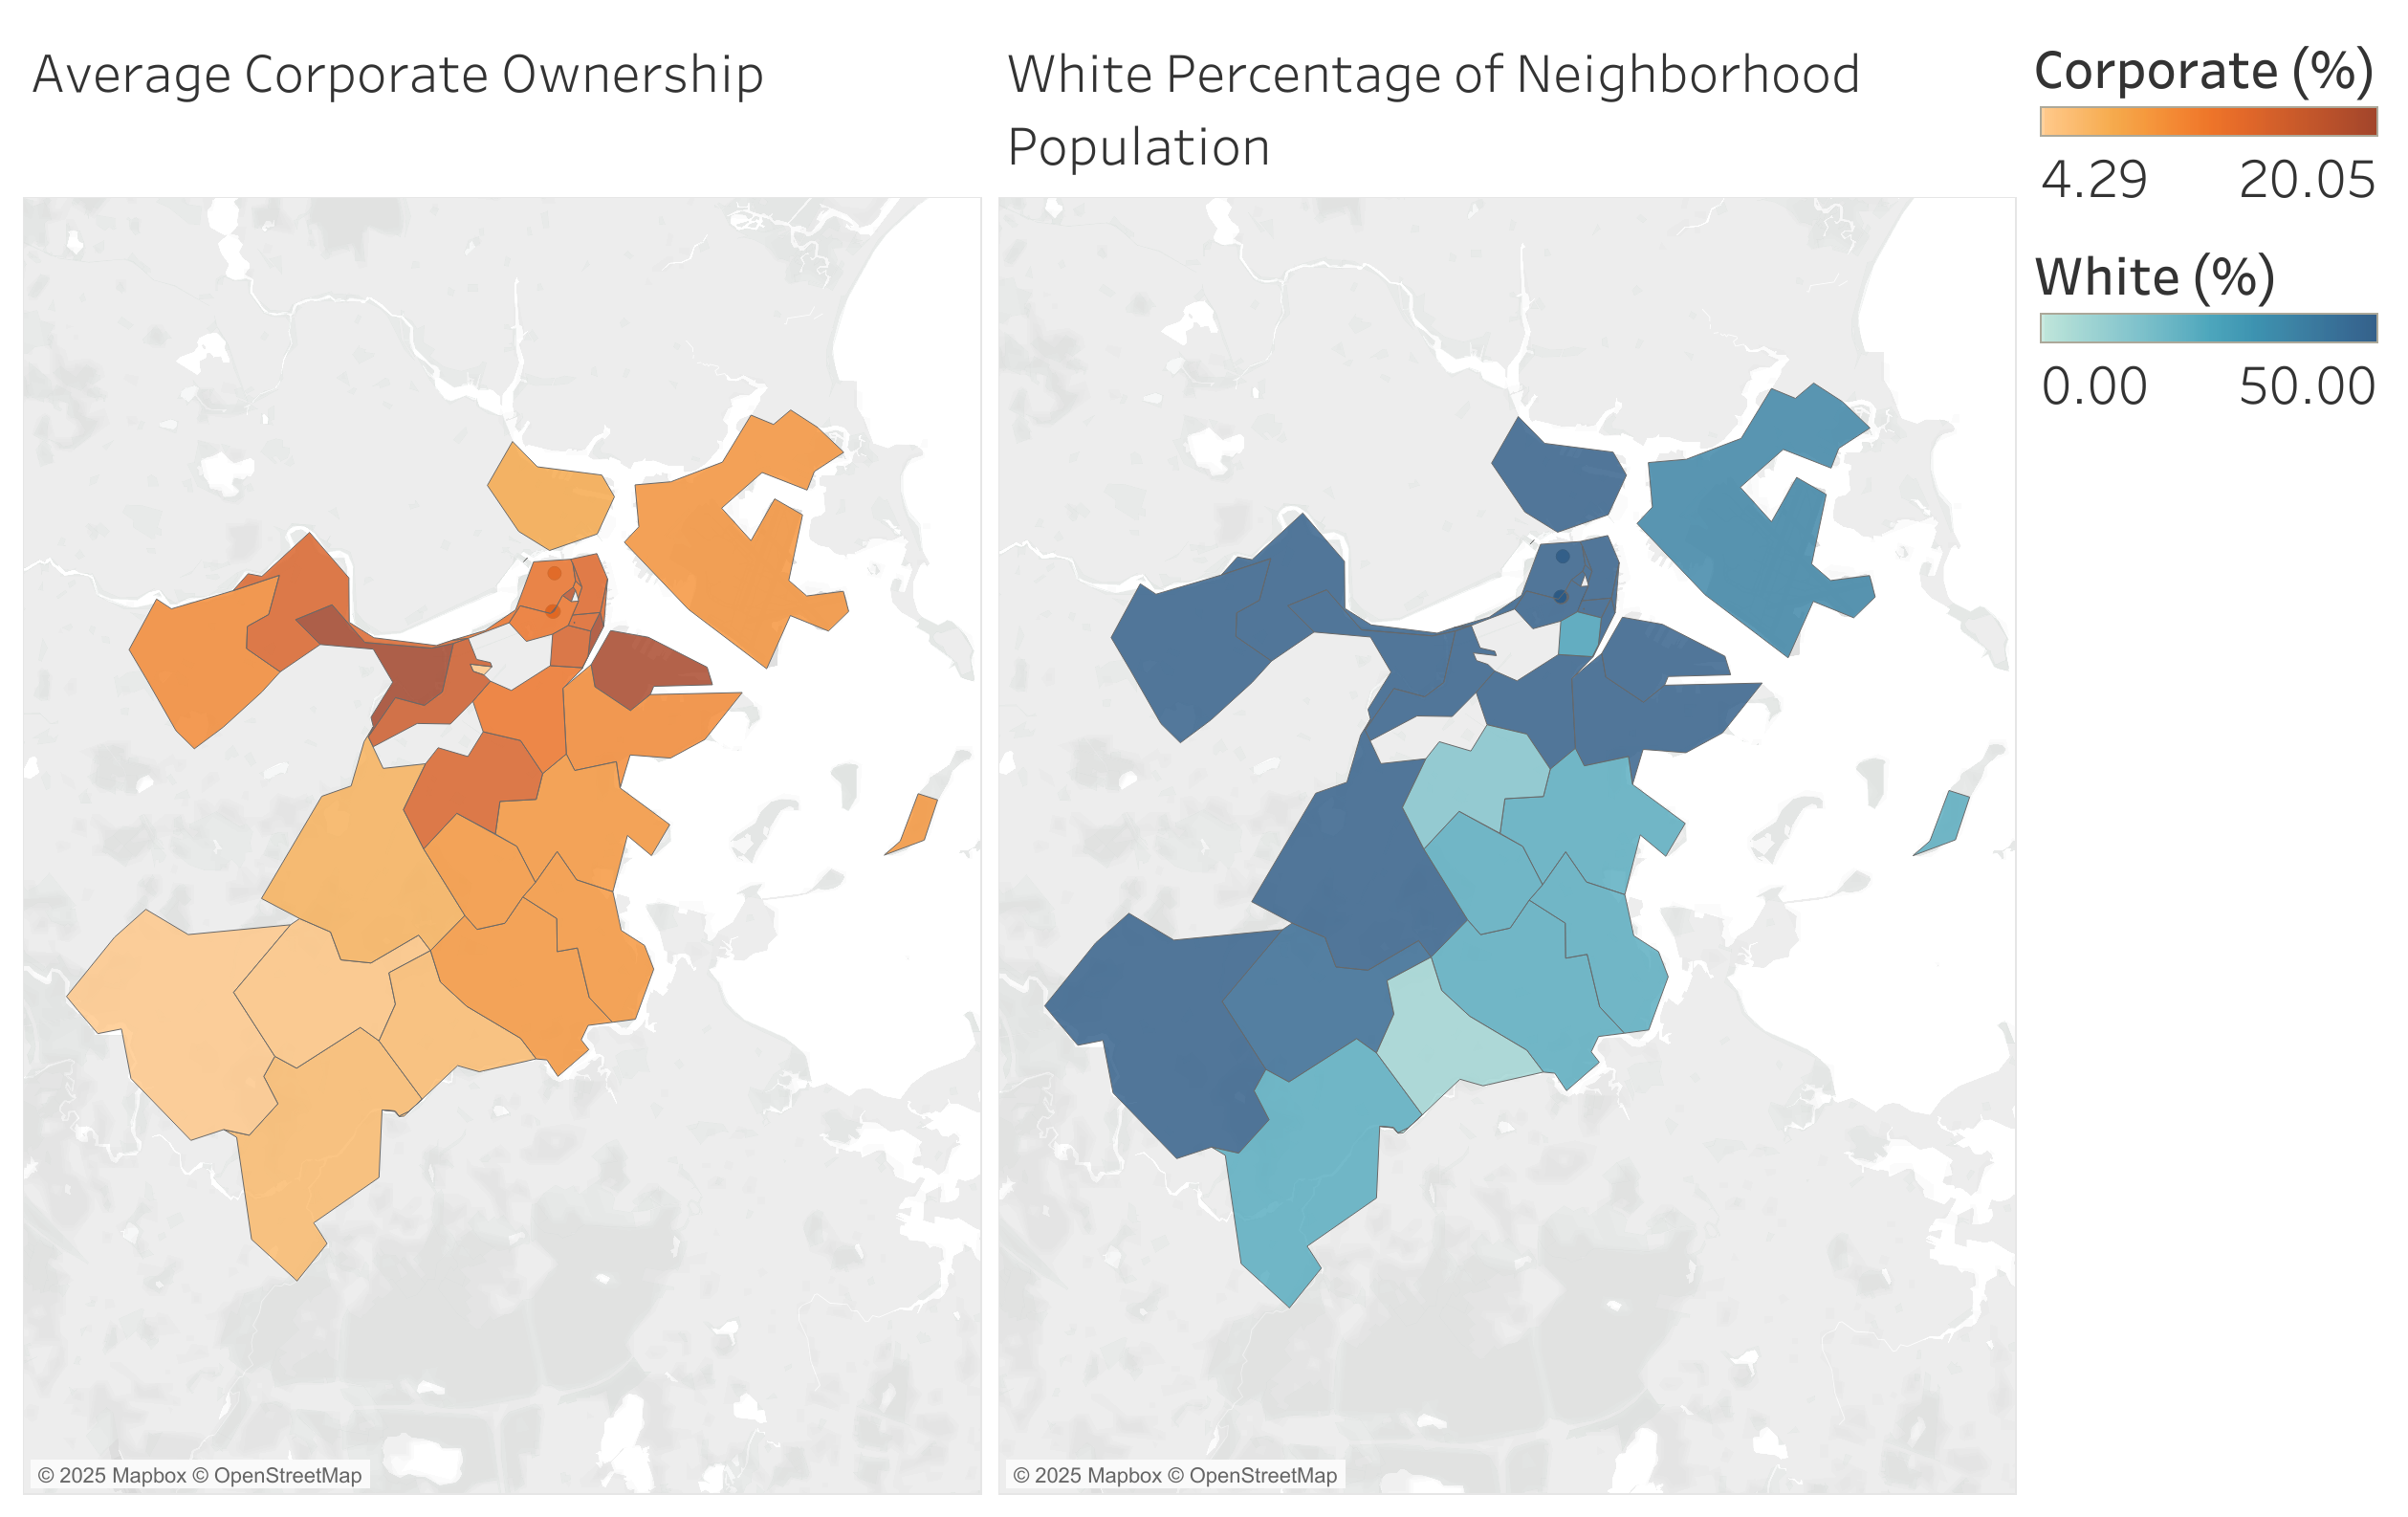
Another related follow up question is; do neighborhood demographics affect speculation (or vice-versa)? Inspecting the census data visualized in the 'overview' section, no clear correlation between corporate ownership and neighborhood demographic is evident, except that the highest rates of corporate ownership occur in neighborhoods which have a higher proportion of white people, illustrated below. Since neighborhoods with high proportions of white populations are spread across areas with both high and low corporate ownership rates, it is difficult to determine whether speculation attracts white populations, forces out other demographics, or if this is simply a coincidence -- correlation without causation.
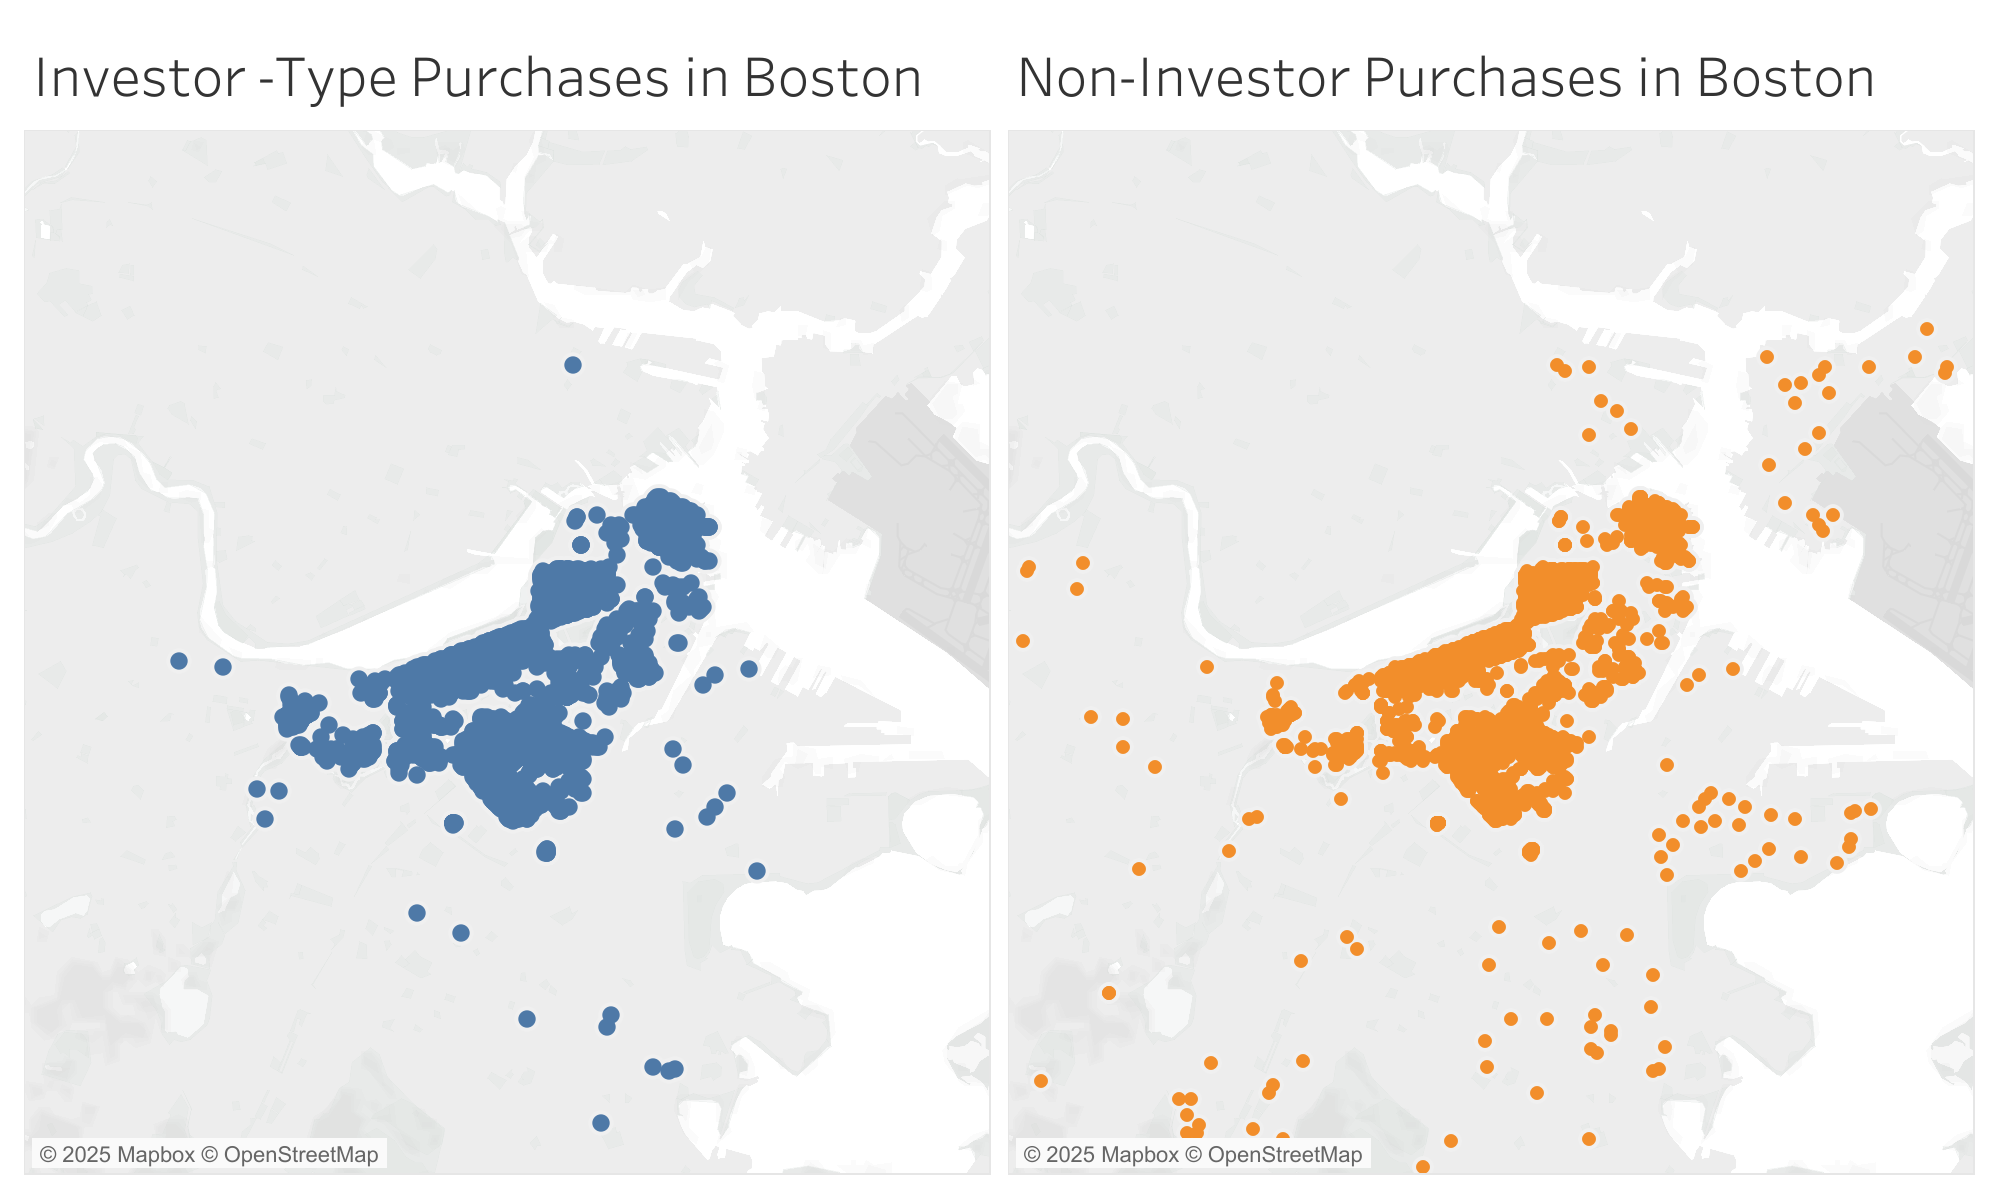
We can also assess speculation using dataset 2, although this dataset contains very few records more than 3 miles from Downtown, so it cannot provide the same level of insight as dataset 1. The figure below illustrates the sale type of each property in Boston; notably, there are many 'Non-Investor' type sales occluded by Investor-Type sales in the central neighborhoods, so a faceted display is used. This makes it clear that, within the city center, speculation is not concentrated in any particular neighborhoods. This is compatible with our analysis using the first dataset, suggesting that speculation is most prevalent in the most central neighborhoods, but not particularly concentrated about one central point. This can be further confirmed using the last figure in the 'overview' analysis of dataset 2, which shows how investor type purchases are relatively uniformly distributed over distances less than 2 miles from the Old State House.
Question 1, Dataset 2 Processing:
1. Apply filtering described in 'overview' section.
2. Aggregate 'investor-type-purchase' data into a binary variable.
Question 1 Conclusions:
1. Speculation is concentrated within 3 miles of the city center and has less of an impact on neighborhoods further away.
2. Speculation is relatively uniformly distributed within the city center neighborhoods (Back Bay, Beacon Hill, Downtown etc').
3. These datasets do not contain sufficient information to properly evaluate the impact of corporate ownership rates on property prices in neighborhoods.
4. Corporate ownership is highest in neighborhoods with larger white populations, but neighborhoods with larger white populations do not all have high rates of corporate ownership.
2. How do corporate owners change their neighborhoods?
Dataset 1 is most relevant to this question, although the lack of census data from years other than 2020 makes it difficult to assess how corporate ownership changes communities over time. While we could draw conclusions based on the 2020 census and corporate ownership data, that would risk conflating causality with correlation and is an unwise methodology. This is not a question that can be answered properly using these datasets. As explained in the follow-up to question 1, we can see that neighborhoods with the highest corporate ownership rates also have large proportions of white residents, but this tells us little about causation.
Question 2 Conclusions:
1. It is not possible to draw strong conclusions about the effects of speculation on neighborhood demographics from this data alone.
3. Are luxury investment properties the primary cause of housing shortages and high prices in Boston?
We shall consider luxury investment properties to be those which are not primarily developed or sold for the purpose of providing shelter and a primary residence to the owners. This question focuses on whether properties built specifically for the purpose of investment are using up space that could be used for affordable and owner-occupied homes. While owner occupancy data from dataset 1 can provide insights about the distribution of investment properties, it does not provide sufficient information about new-build properties to help answer this question. Therefore, we shall focus on dataset 2 for this analysis.
Luxury developments could be identified in several ways. For this analysis, we shall define them based on whether they are likely to be the owner's primary residence, or if the buyer is an investor. First, properties are filtered by their age at the time of sale (only considering new-builds less than 3 years old). Second, they are filtered by buyers who own multiple properties using the 'tot owned' and 'buyer purchases' fields or properties classified as an investor-type purchase. All of the relevant (non-spatial) filters described in the 'overview' section are also applied to remove spurious data. This methodology won't be perfect, but it provides a good approximation for investment-focused property developments. The dataset contains 653 records of newly built properties that are unlikely to serve as a primary residence, and we can validate that the filtering has worked by looking up some of those properties:
- 1 Avery St. (#14B) is an apartment in the Ritz-Carlton condominium, which (even just by name) is clearly a luxury development. (LuxuryBoston.com, 2025).
- 45 Province St. (#1508) is categorized as a "luxury condo development". (LuxuryBoston.com, 2025)
- 2 Rollins St. (#D601) is another multi-million dollar apartment, built in 2002. The apartment is certainly luxurious, and it appears that the building was intended for investment-focused buyers, although one might be able to argue that this property is simply a high-value home. (Zillow, 2025)
- 10 Bowdoin St. (#206) also features in online "luxury" realtor advertisements, cementing it's position as an investor-focused development. (Boston Luxury Residential, 2025)
- The list goes on...
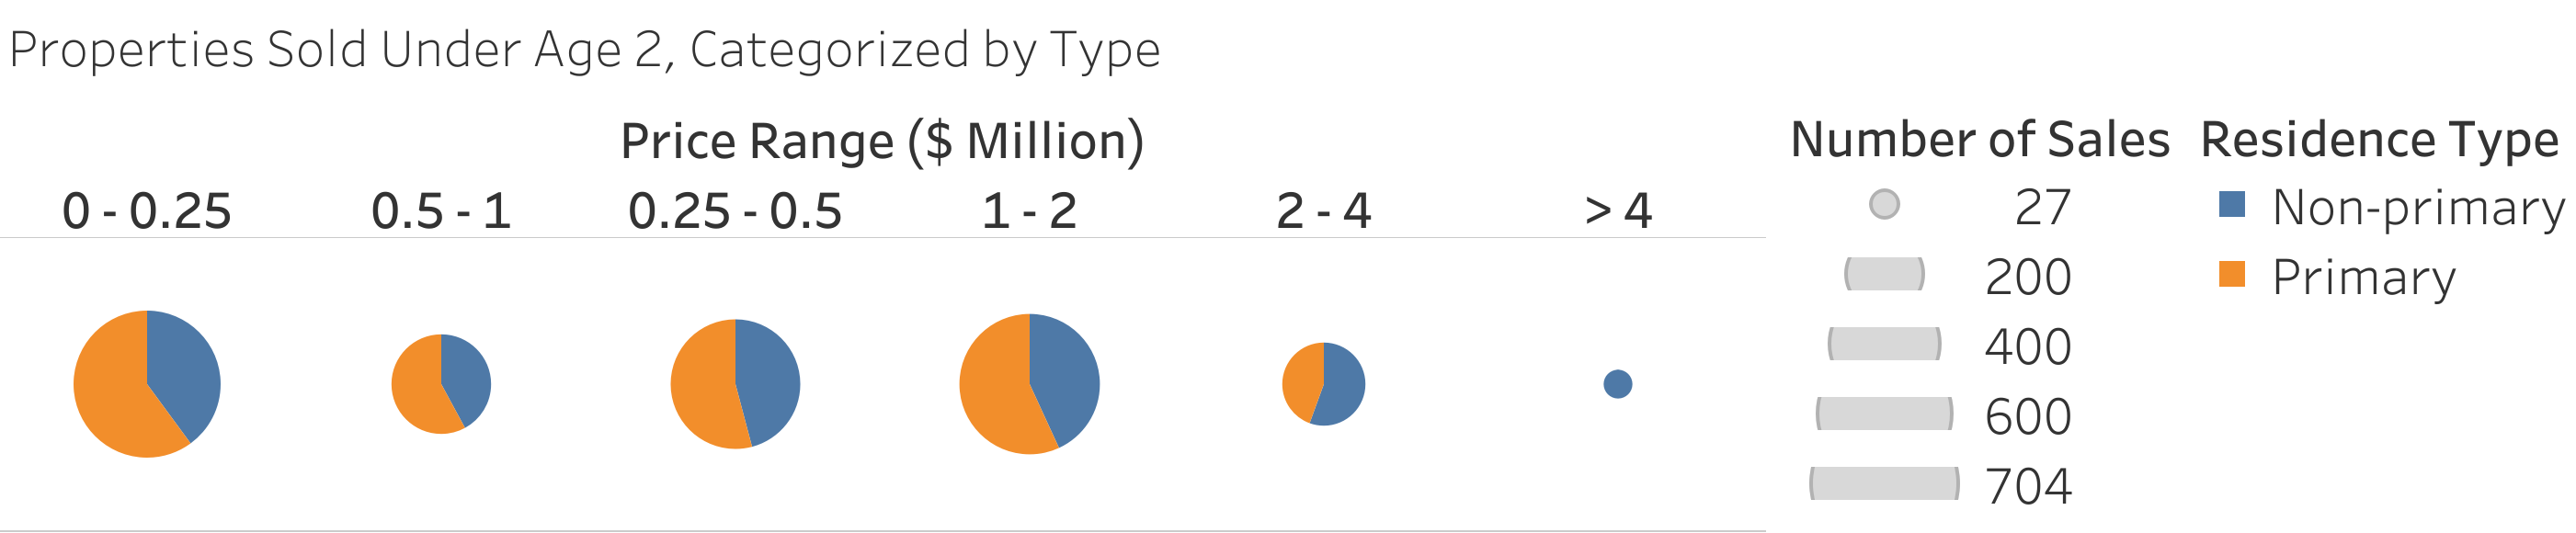
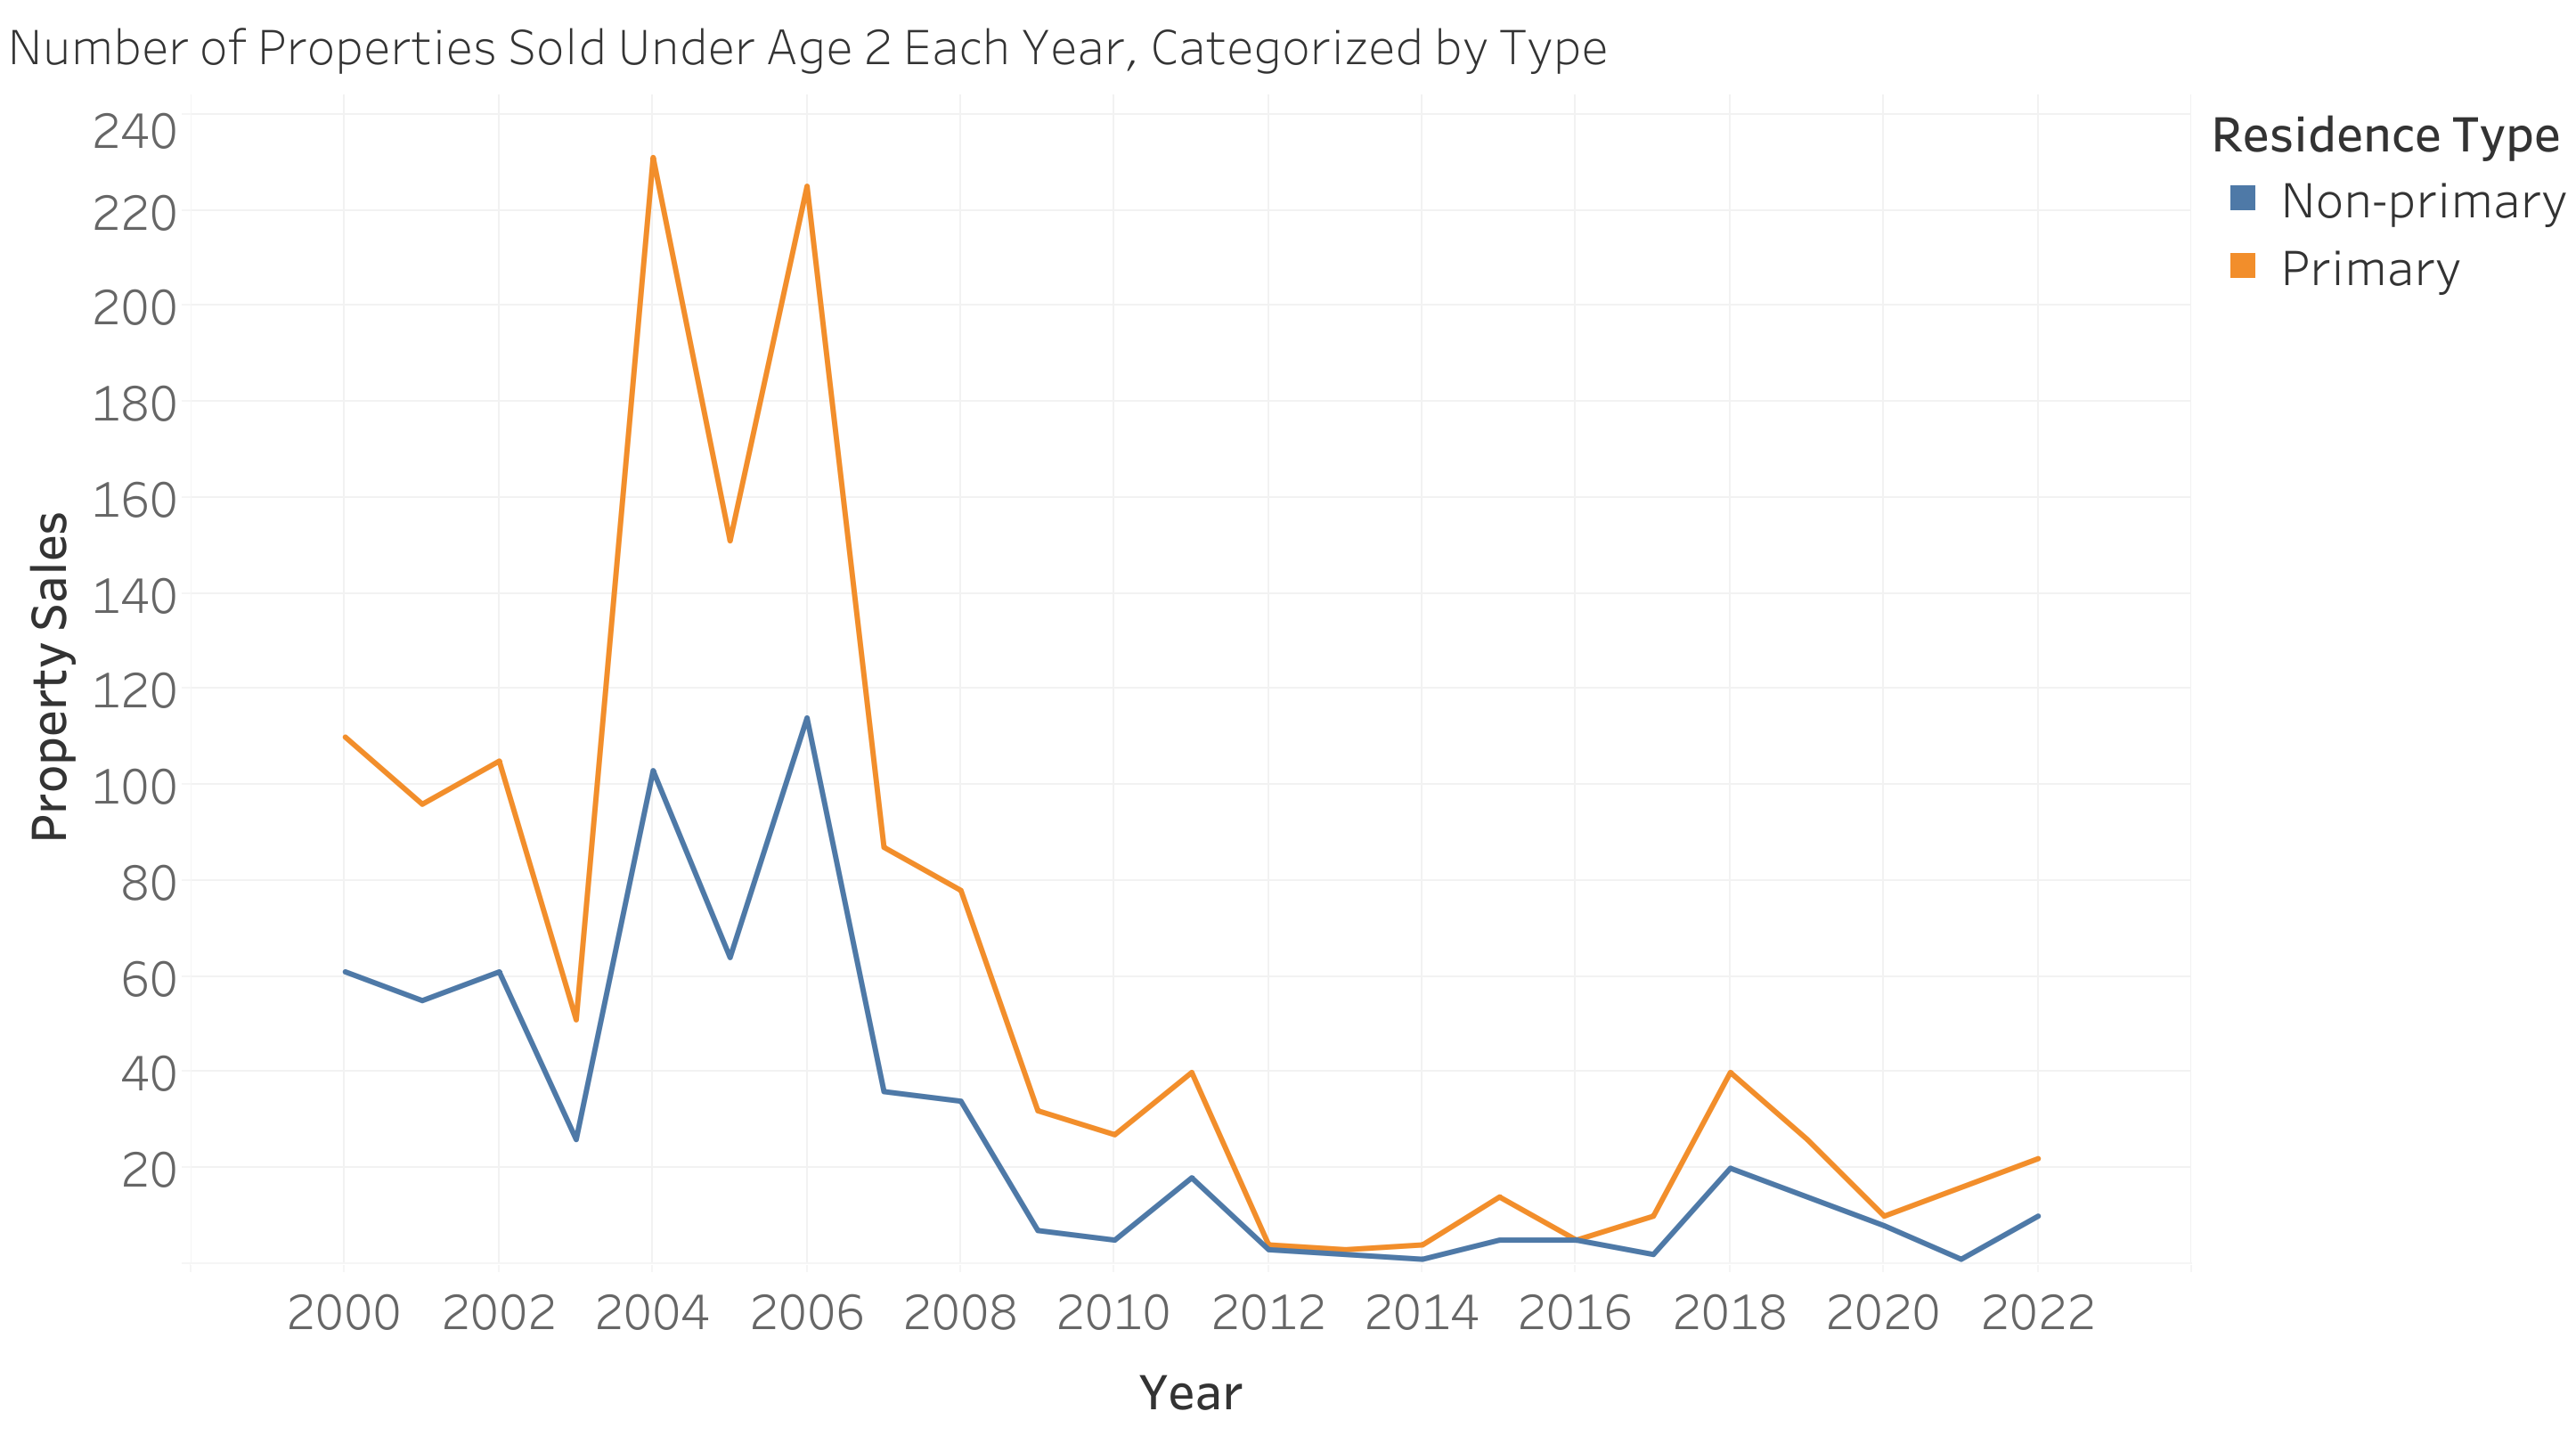
Having validated that this filter does a good job of highlighting luxury investment properties, we ask the question: do these properties constitute a significant proportion of all property devlopments and sales in Boston? The figure below shows the number of property sales each year where the building was likely to be a new-build, with non-primary residences separated. This shows that the number of luxury investment sales almost matches other properties, which suggests that such properties constitute a significant proportion of Boston's new-build housing supply. This is especially obvious after 2010, as the number of primary and non-primary residence sales become almost equal.
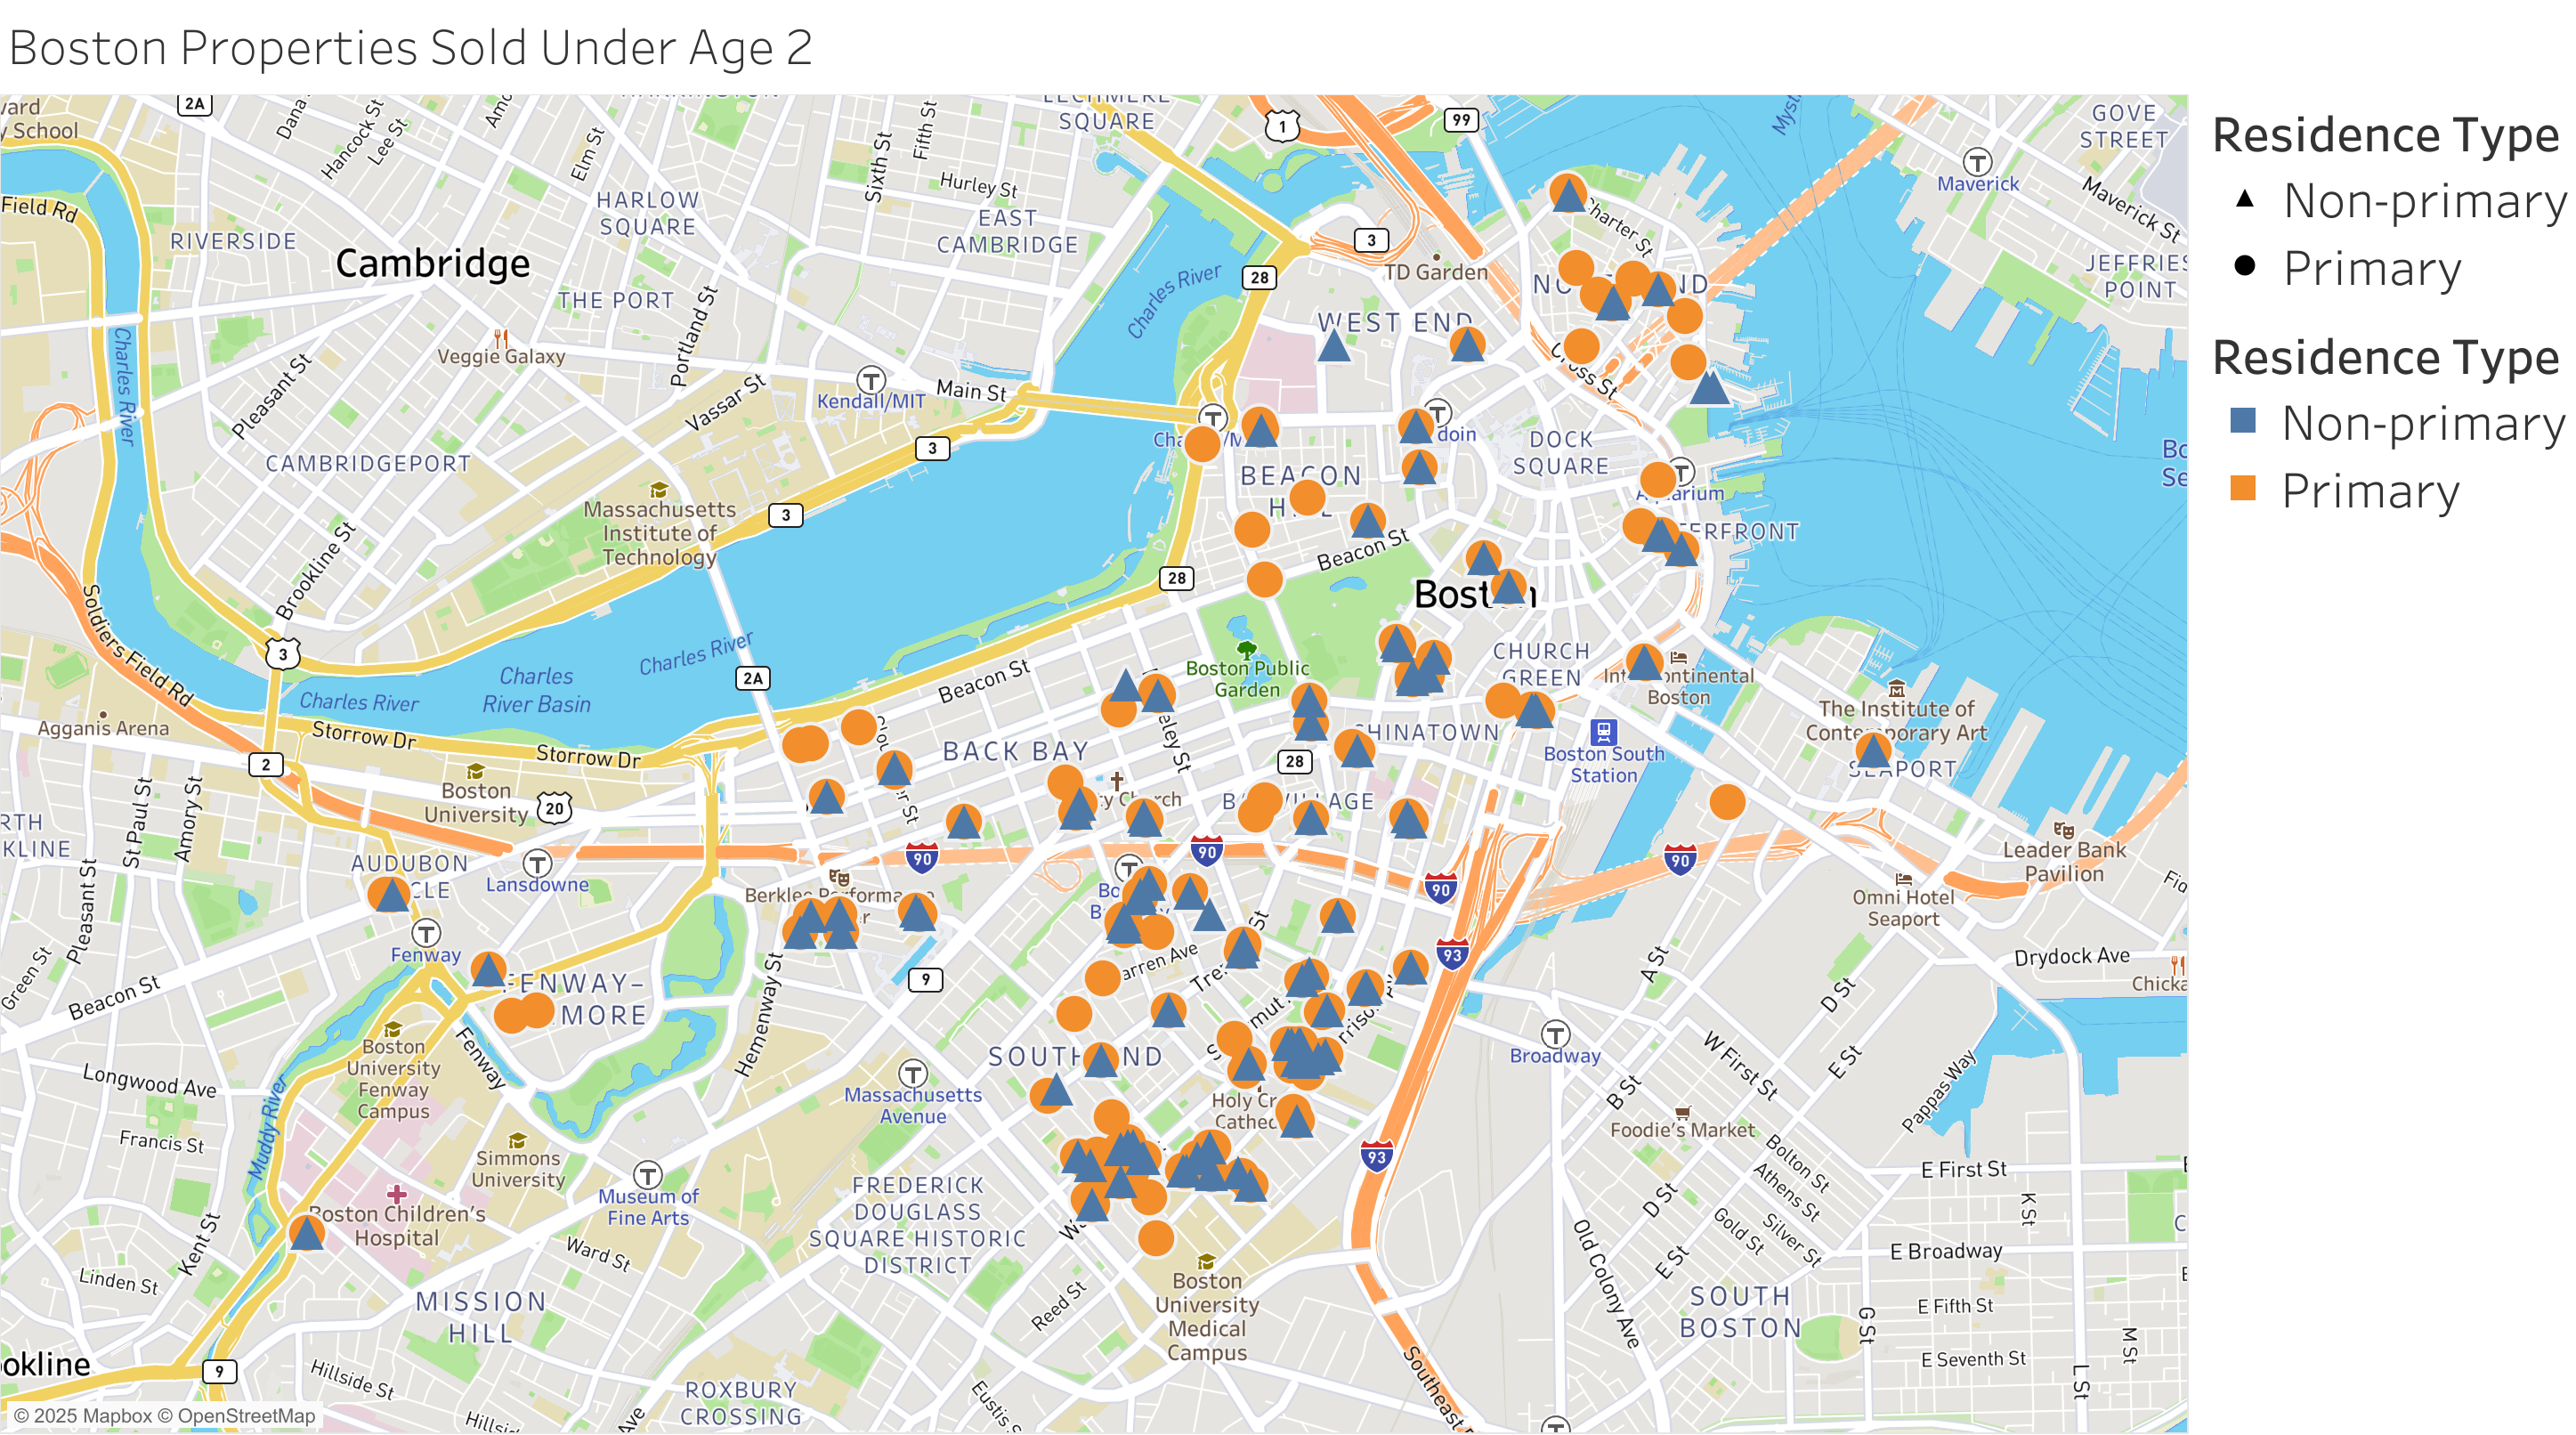
Understanding how many new-build properties are sold as non-primary residences raises the follow-up question: where are these luxury developments located, and are there any trends?. Ignoring records with spurious spatial data (it seems that luxury property sales tend to come with more secretive record-keeping), the figure below shows the locations of 'new-build' properties separated by type. This highlights trends in building construction; more properties, especially investor-focused properties, are being built in the South End neighborhood, which has been 'gentrified' over the past 2 decades (Shaw D, 2020). Perhaps this is Boston's equivalent to the "investors moving out" discussed in question 1. In contrast, new-build sales in the North End, historically opposed to large corporations, are dominated by primary residences.
Question 3 Dataset 2 Processing:
1. Apply filtering described in 'overview' section.
2. Separate 'new build'' developments using 'age at time of sale' (2 years and under).
3. Separate 'non-primary' residences using 'tot owned' and 'buyer purchases' (either value >1).
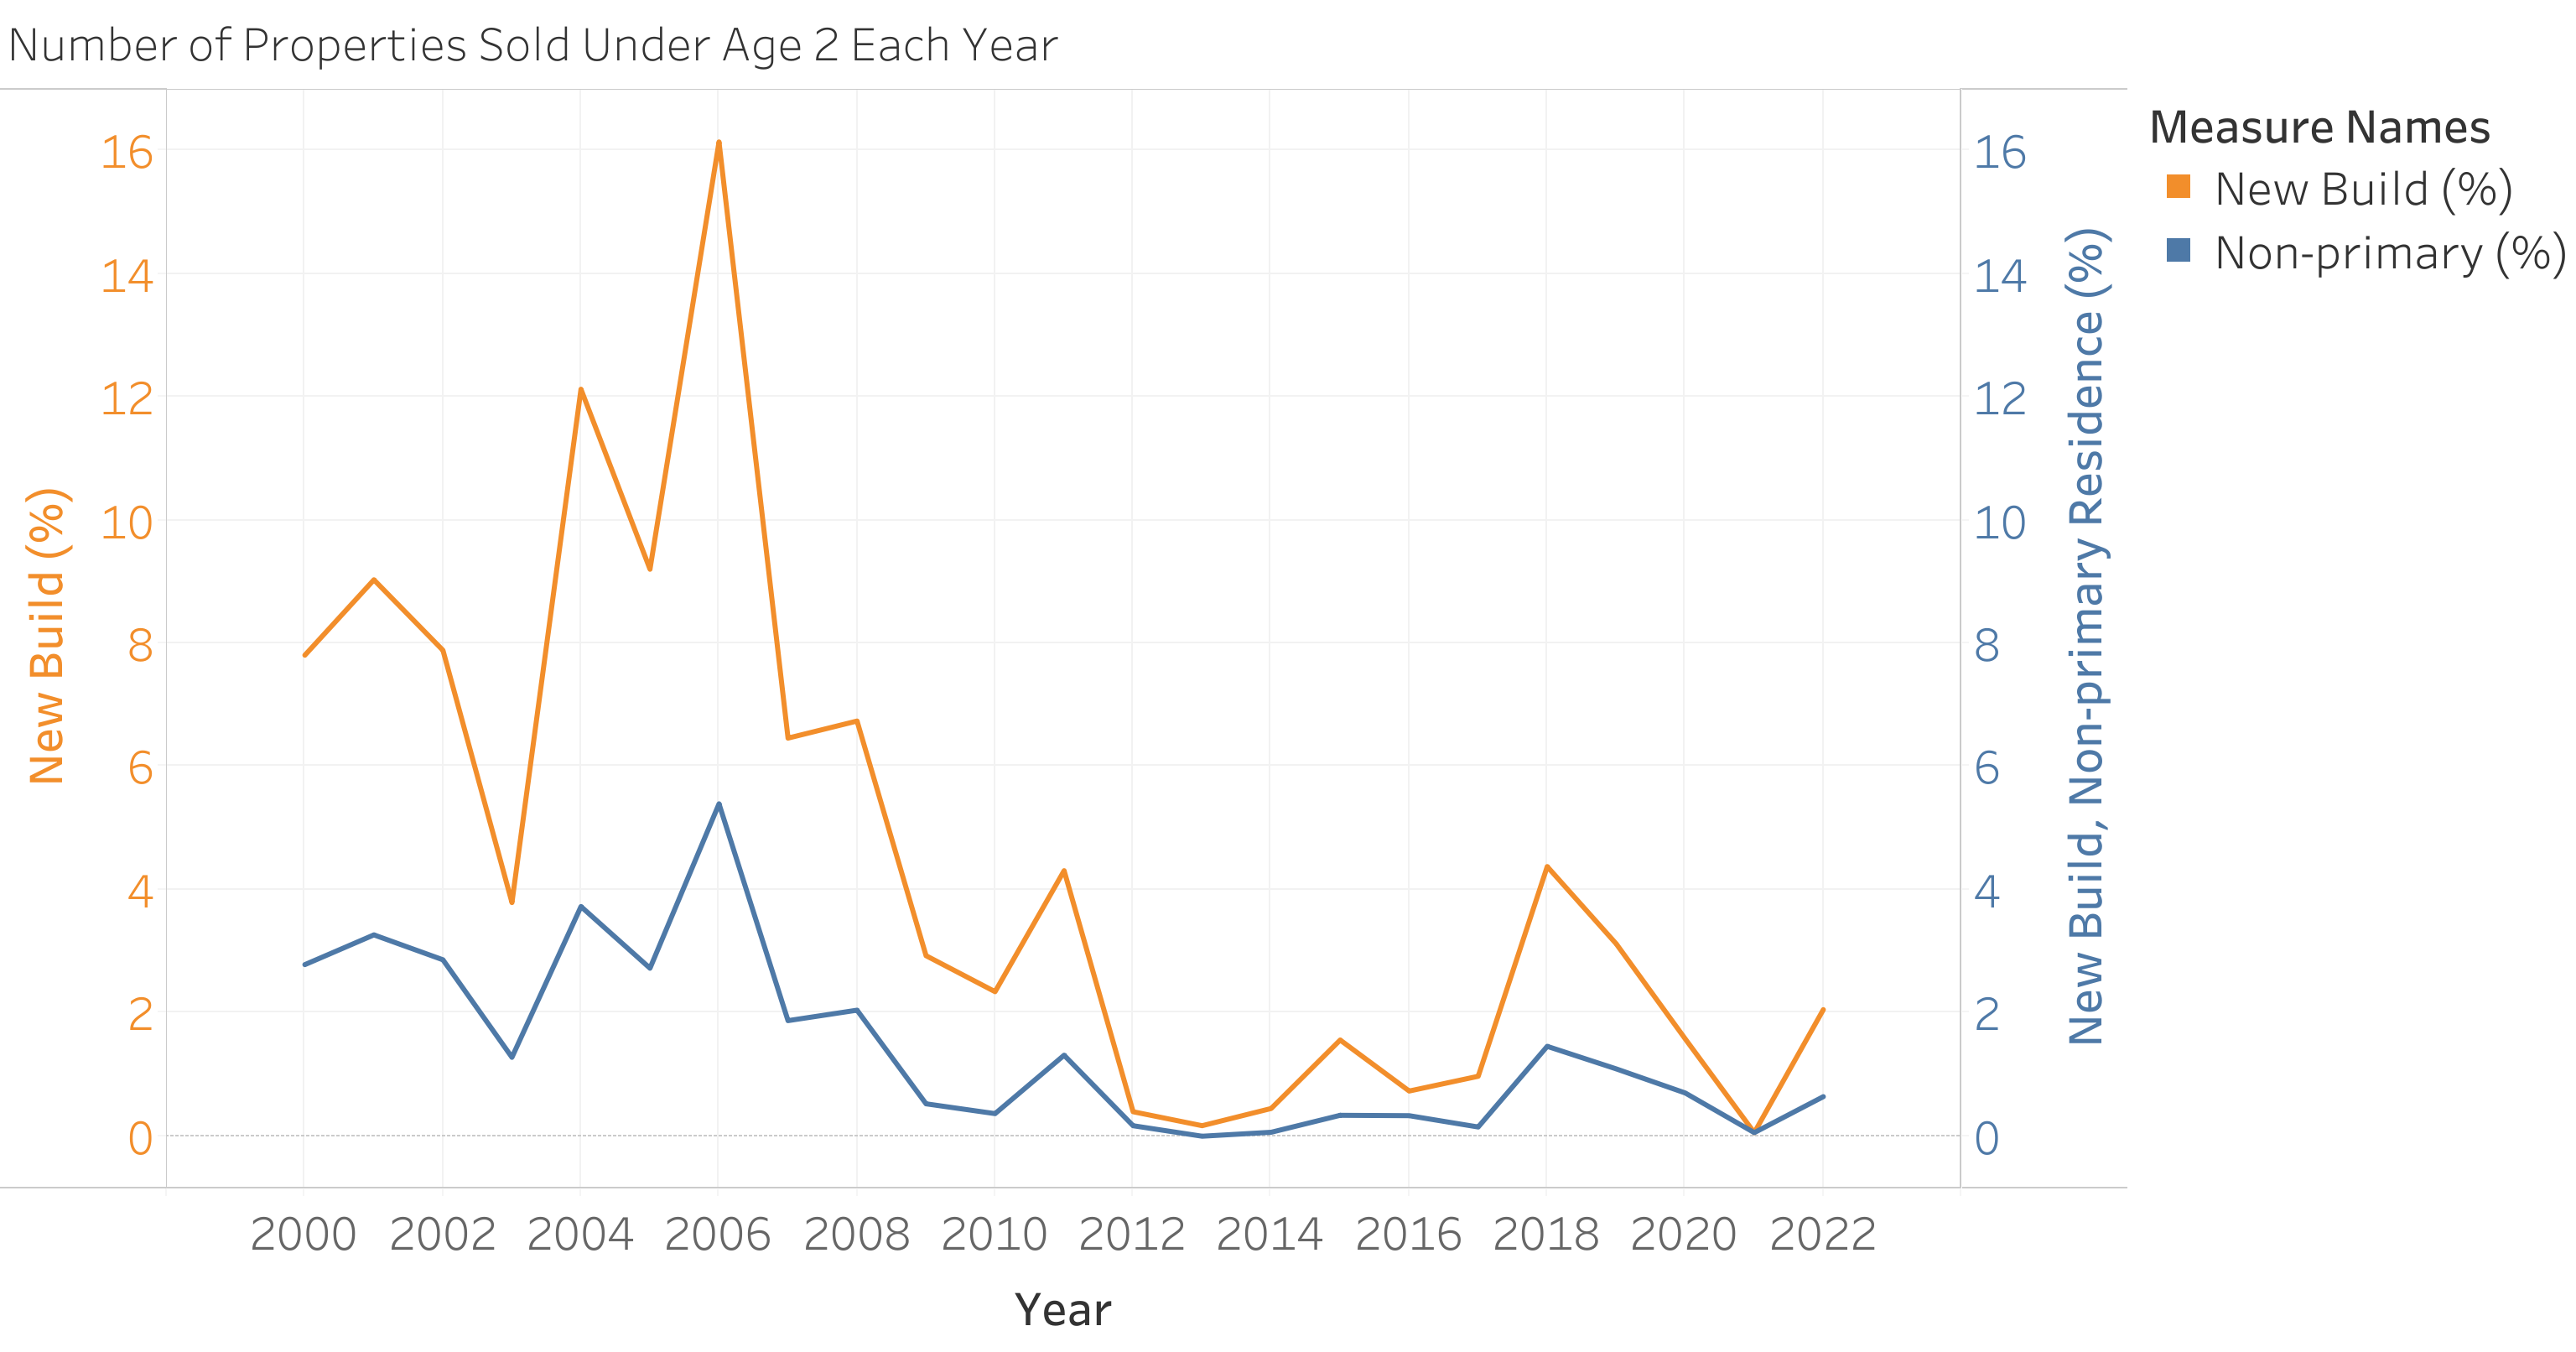
4. Calculate 'non-primary' and 'new build' sales data as a percentage of total sales each year.
Question 3 Conclusions:
1. Non-primary residences developments dominate the newly-built property market in Boston.
2. New-build properties only make up a small percentage of total property sales in Boston.
3. Therefore, luxury investment properties are unlikely to be solely responsible for high property prices in Boston.
4. However, a large proportion of new-builds are sold as non-primary residences, so property developers are likely to be prioritizing high-value developments over affordable housing, in this particular region of Boston.
5. Correlation does not necessitate causation, so investigation of other factors is needed to determine whether speculation is to blame for the lack of affordable housing (or whether speculation has become more prevalent because of the lack of affordable housing).
6. This data is restricted to a relatively small area of Boston, so conclusions cannot be extrapolated to other parts of the city or the greater Boston area.
4. Is there a discrepancy between investment value and owner-occupied property value?
This question concerns whether properties in Boston are more valuable to investors than to locals. Since it concerns price information, we shall use dataset 2. Since investor property valuations are important, we shall not immediately filter out investor-investor sales (for this analysis only). Spurious records with average annual values exceeding $5000 per square foot per year were excluded, since these properties were found to have spurious values for intersqft and/ or price.
Since investors tend to purchase more expensive properties, a good comparison of 'value' is the price per square foot. Two metrics were created to evalaute this; the sale price per (interior) square foot, and the 'average annual value' per (interior) square foot. The figure below shows how these values have changed over time, considering investor-type and non-investor-type purchases.
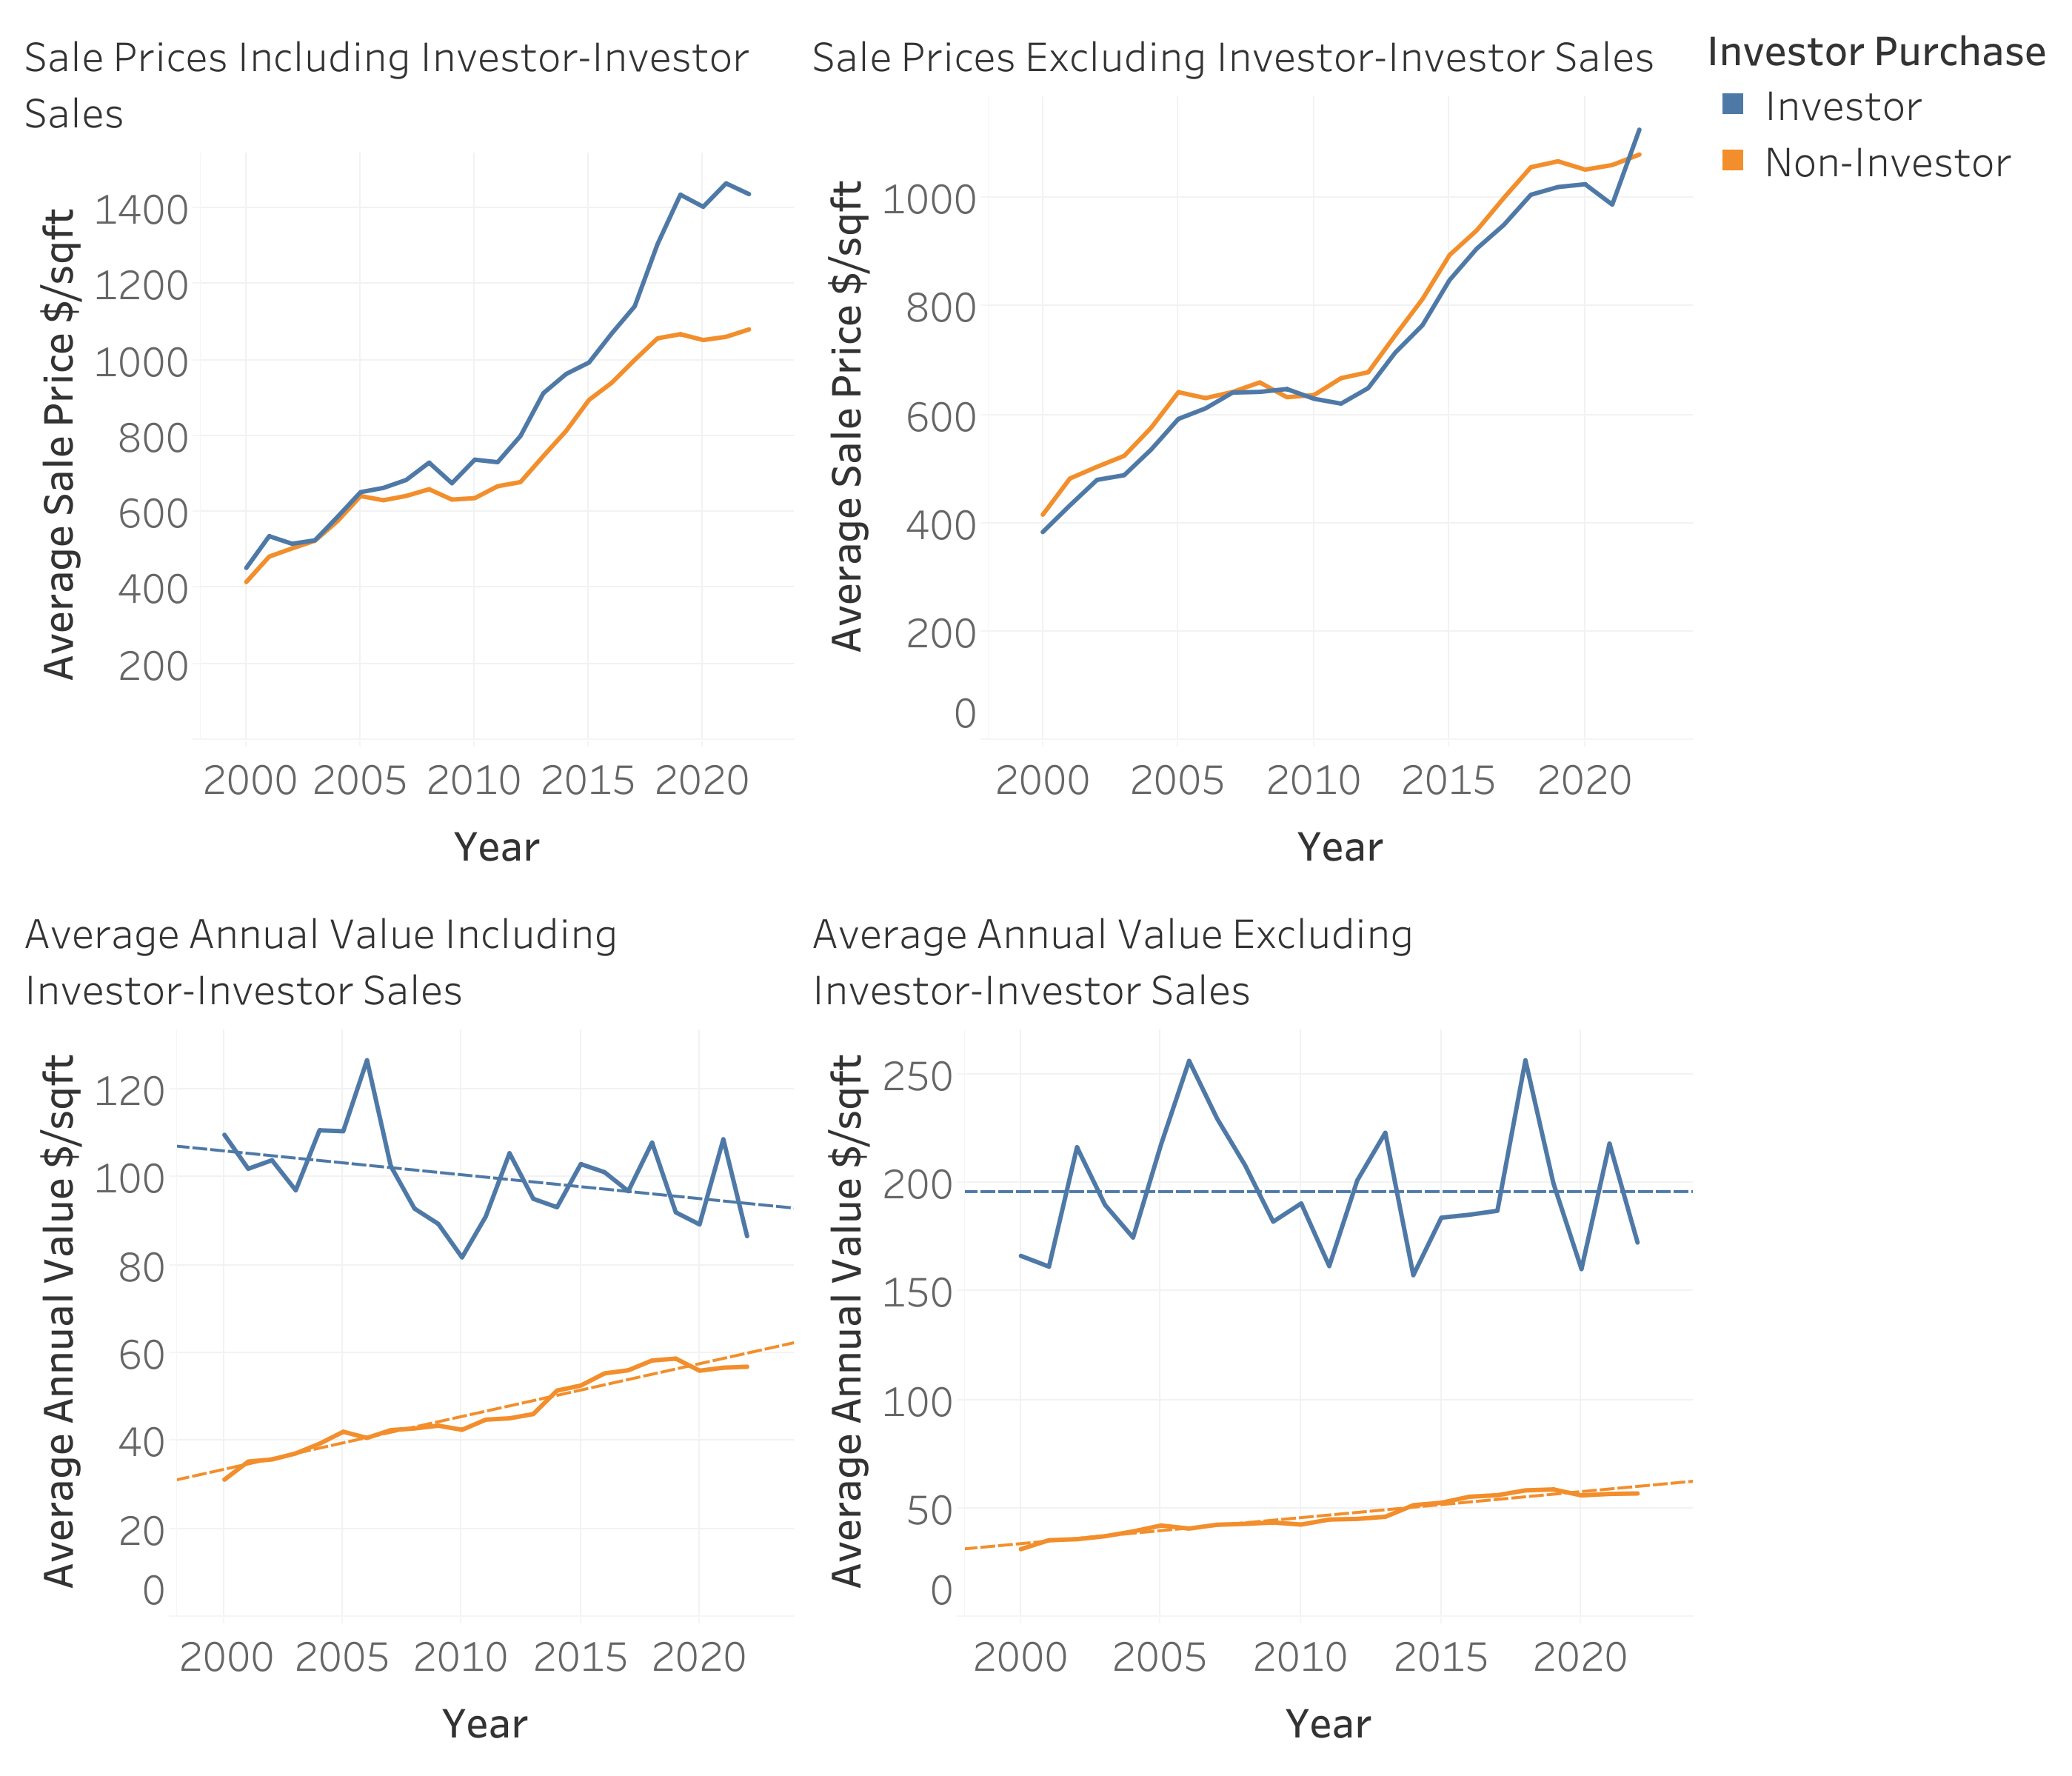
From this figure, it appears that investors do not necessarily pay higher sales prices than non-investors, but they do reap greater annual value from the properties they purchase. The exact meaning of the 'average annual value' is not sufficiently explained by metadata to draw strong conclusions here, but this does suggest that there is a noticeable difference between how investors and non-investors go about purchasing properties, as one would expect. When considering the impact this has on house prices across Boston, this data is not particularly insightful about whether market prices are determined by a property's investment value, or the actual value to occupants. Investors seem to pay above-market rate when making investor-investor sales, but below-market rate when trading with non-investors.
This raises a follow-up question: do differences in property value become more apparent when adjusting for property characteristics? For example, investors might prefer properties in desirable locations with more luxury amenities, and might be willing to pay a premium for such properties. This kind of discrepancy wouldn't necessarily be visible in the diagram above. Since amenity data is listed in a complex fashion, a comprehensive analysis of this is outside of the scope of this work, but could be interesting in the future. The effect of distance from the city center was investigated, but there is no clear trend when plotting variations in average annual value over the distance from the Old State House. This suggests that investors reap higher average annual values consistently across central Boston.
Question 4 Processing:
1. Apply filtering described in 'overview' section, but do not filter out investor-investor sales.
2. Filter out records with a price per square foot above $5000.
3. Compute value per square foot data.
Question 4 Conclusions:
1. Investors reap higher annual values (per square foot) than non-investors.
2. Investors do not routinely pay more per square foot than non-investors.
3. It is difficult to conclude whether investors are paying fair market rates for properties, and just make higher annual values, or if the presence of investors has driven up property prices.
4. This trend is not significantly affected by the distance of properties from the city center.
Lessons Learned
Regarding speculation in Boston, this data has revealed:
- Corporate ownership (corresponding to speculation) is higher near the city center, but is not particularly concentrated in any single neighborhood.
- The neighborhoods with the highest corporate ownership rates have relatively high proportions of white residents, but not all neighborhoods with larger white populations have high corporate ownership rates.
- Census data from multiple years would be needed to properly evaluate the transient effects of corporate ownership on neighborhoods.
- New-build properties in boston only constitute about 5% of total property sales. Just under half of new-build sales can be classified as non-primary residences.
- The proportion of newly-built properties that are sold as non-primary residences has increased over the last 20 years.
- The number of luxury investment properties being built is increasing faster than the number of affordable homes built in central Boston.
- The correlation between luxury investment properties and changes in Boston's housing market cannot be firmly linked to a causation using this data.
- Investors, on average, do not pay substantially more (per square foot) for properties than non-investors, but they do attain much higher average annual values per square foot.
- Distance from the city center does not significantly affect investors' willingness to pay market rates.
- This data (and my novice understanding) does not reveal information about the causality of market rates; more expert analysis is needed to determine conclusively whether investors have artificially driven up property prices.
I also found that much more time was spent cleaning the data than analyzing it. Applying consistent filtering was difficult to manage in Tableau, but I can think of very easy ways to manage it using programatic tools like Matlab. Selecting appropriate visualization types was a fun exercise, although I found myself often defaulting to a line plot, and having to think intentionally about other, possibly more effective, methods for visualizing data (Tableau was helpful for this).